


Introduction
A number of studies have been published with the adoption of LiDAR technique for archaeological research, reporting findings of significant implications among international archaeology researchers.1 However, there have been few reports on archaeological studies using LiDAR in South Korea. Although there were studies of reconstruction and restoration of damaged mountain fortress walls or past topographic features using aerial archeology,2 there have been no tangible research outcomes using LiDAR to date.
In international archaeological research, LiDAR has been used as a remote sensing technology for exploring shapes of remains or relics located in isolated places or in the middle of a deep forest. In particular, the advantage of LiDAR data that allows for the observation of specific objects such as buildings on the ground in a physical environment, even in the presence of various shapes of natural and artificial obstacles, 3 is a useful feature. When approaching the topographical characteristics of South Korea, where 75% of the nation’s land area is covered by mountains,4 this feature can be effectively implemented.
South Korea has numerous relics from the past befitting the country’s long history. However, most of the relics were damaged over a long period of time or destroyed altogether from relentless land development in the 1960s and 1970s. In addition, since the Korean War, visits to the Demilitarized Zone (DMZ) or North Korea for research are not possible in practice.
In order to overcome the practical limitations and implement an effective methodology for archaeological research, we aim to apply remote sensing technology using LiDAR, which has drawn much attention in the global archaeological community, to real archaeological sites in South Korea and explore methods to enhance utilization of this technology.
Overview of LiDAR Technology
1) Definition of LiDAR Technology
“Remote Sensing” is a term first introduced in the United States in the early 1960s. According to The American Society of Photogrammetry and Remote Sensing (ASPRS), remote sensing is generally defined as a technology for acquiring information about an object without direct physical contact.5 Currently, a wide range of remote sensing equipment and systems such as satellites, airplanes, and drones provide technology unique to their individual differences with novel approaches.
In Light Detection And Ranging (LiDAR), one of the remote sensing technologies, pulses are emitted from a laser source towards a target, and reflection and absorption of the laser energy are used for detection and collection of a wide range of information such as the distance to the object, direction, speed, temperature, properties of material distribution and concentration, and 3D image information.6 Since the method is not affected by light, observations can be made for the intended target without being affected by weather conditions such as clouds. Depending on the type of equipment mounted, LiDAR is classified into aerial LiDAR survey using an aircraft, terrestrial LiDAR survey used on the ground, and satellite laser ranging (SLR) used on a satellite.7
LiDAR has three main advantages. First, it allows fast and accurate surveying with high resolution, and various types and forms of outputs can be obtained. Second, the method allows surveying of ground surface by penetrating obstacles such as forests. Finally, remote sensing can be carried out in private and inaccessible places.8 Therefore, it is a technology that enables surveying with precision in areas with limited accessibility.
2) History of archaeological research with LiDAR
LiDAR is a remote sensing technology capable of the visualization of data showing details over an extensive spatial range, which is different from conventional approaches. LiDAR is currently applied in two major areas in the archaeological community. First, in Europe, LiDAR has been used to obtain information on specific areas that had been previously explored, such as castles covered in forests or bushes, furrows, stone alignment (cairns), and coal pits. In tropical regions such as South America and Southeast Asia, LiDAR is utilized for the exploration and interpretation of historical landscapes or for settlement distribution and patterns.9
Archaeological research using LiDAR started in Europe. Stonehenge is one of the first ancient landscapes where LiDAR was applied. Examination of LiDAR data collected for environmental monitoring revealed archaeological evidence that was not observed in previous surveys.10 Also, research was conducted for the acquisition of detailed information of the surface by applying the algorithm to remove vegetation points in LiDAR data. A representative example is the study of a part of the Forest of Dean located south of the border between England and Wales.11 In addition, technology for visual representation of the shape or slope on the ground surface was studied using a range of visualization techniques and filters.12 In particular, in Europe, LiDAR was used to acquire used to acquire detailed information about regions that had been previously surveyed so as to extract a variety of spatial and visualized data or orthophotos that were used in combination for a more extensive analysis.13 This method of aerial LiDAR research has also been effectively applied in regions outside of Europe and has been used to acquire archaeological evidence of irrigated agriculture.14
In Europe, aerial LiDAR research applies various algorithms for classification of archaeological remains and uses many different visualization techniques for analysis. On the other hand, in tropical regions such as South America, aerial LiDAR is used to reveal large-scale ancient landscapes or settlements hidden in jungles. Representative examples include a study that revealed the Caracol settlement of the ancient Maya in Beliz, which had been hidden behind the rainforest canopy of Central America15, and another study that investigated the distribution of the Kingdom of Tonga‘s mound in western Polynesian islands through mounds mapping16.
One recent study using LiDAR with noteworthy results was the research that revealed large-scale early urban settlements of the Casarabe culture in the Bolivian Amazon.17
Case Analysis
As we have seen from cases of research conducted overseas, LiDAR technique has enabled the observation of archaeological evidence even for forested landscapes. Therefore, in this paper, a mountain fortress was selected as the study area. Unlike temples, kilns, or residential dwellings, fortresses generally have exposed features, making a field survey of the site relatively easy. However, because of its large scale, it is difficult to properly observe or visualize the overall shape of the fortress from the ground.18 Therefore, it was anticipated that the overall dimension and shape of the mountain fortress could be acquired with an introduction of the LiDAR technique.
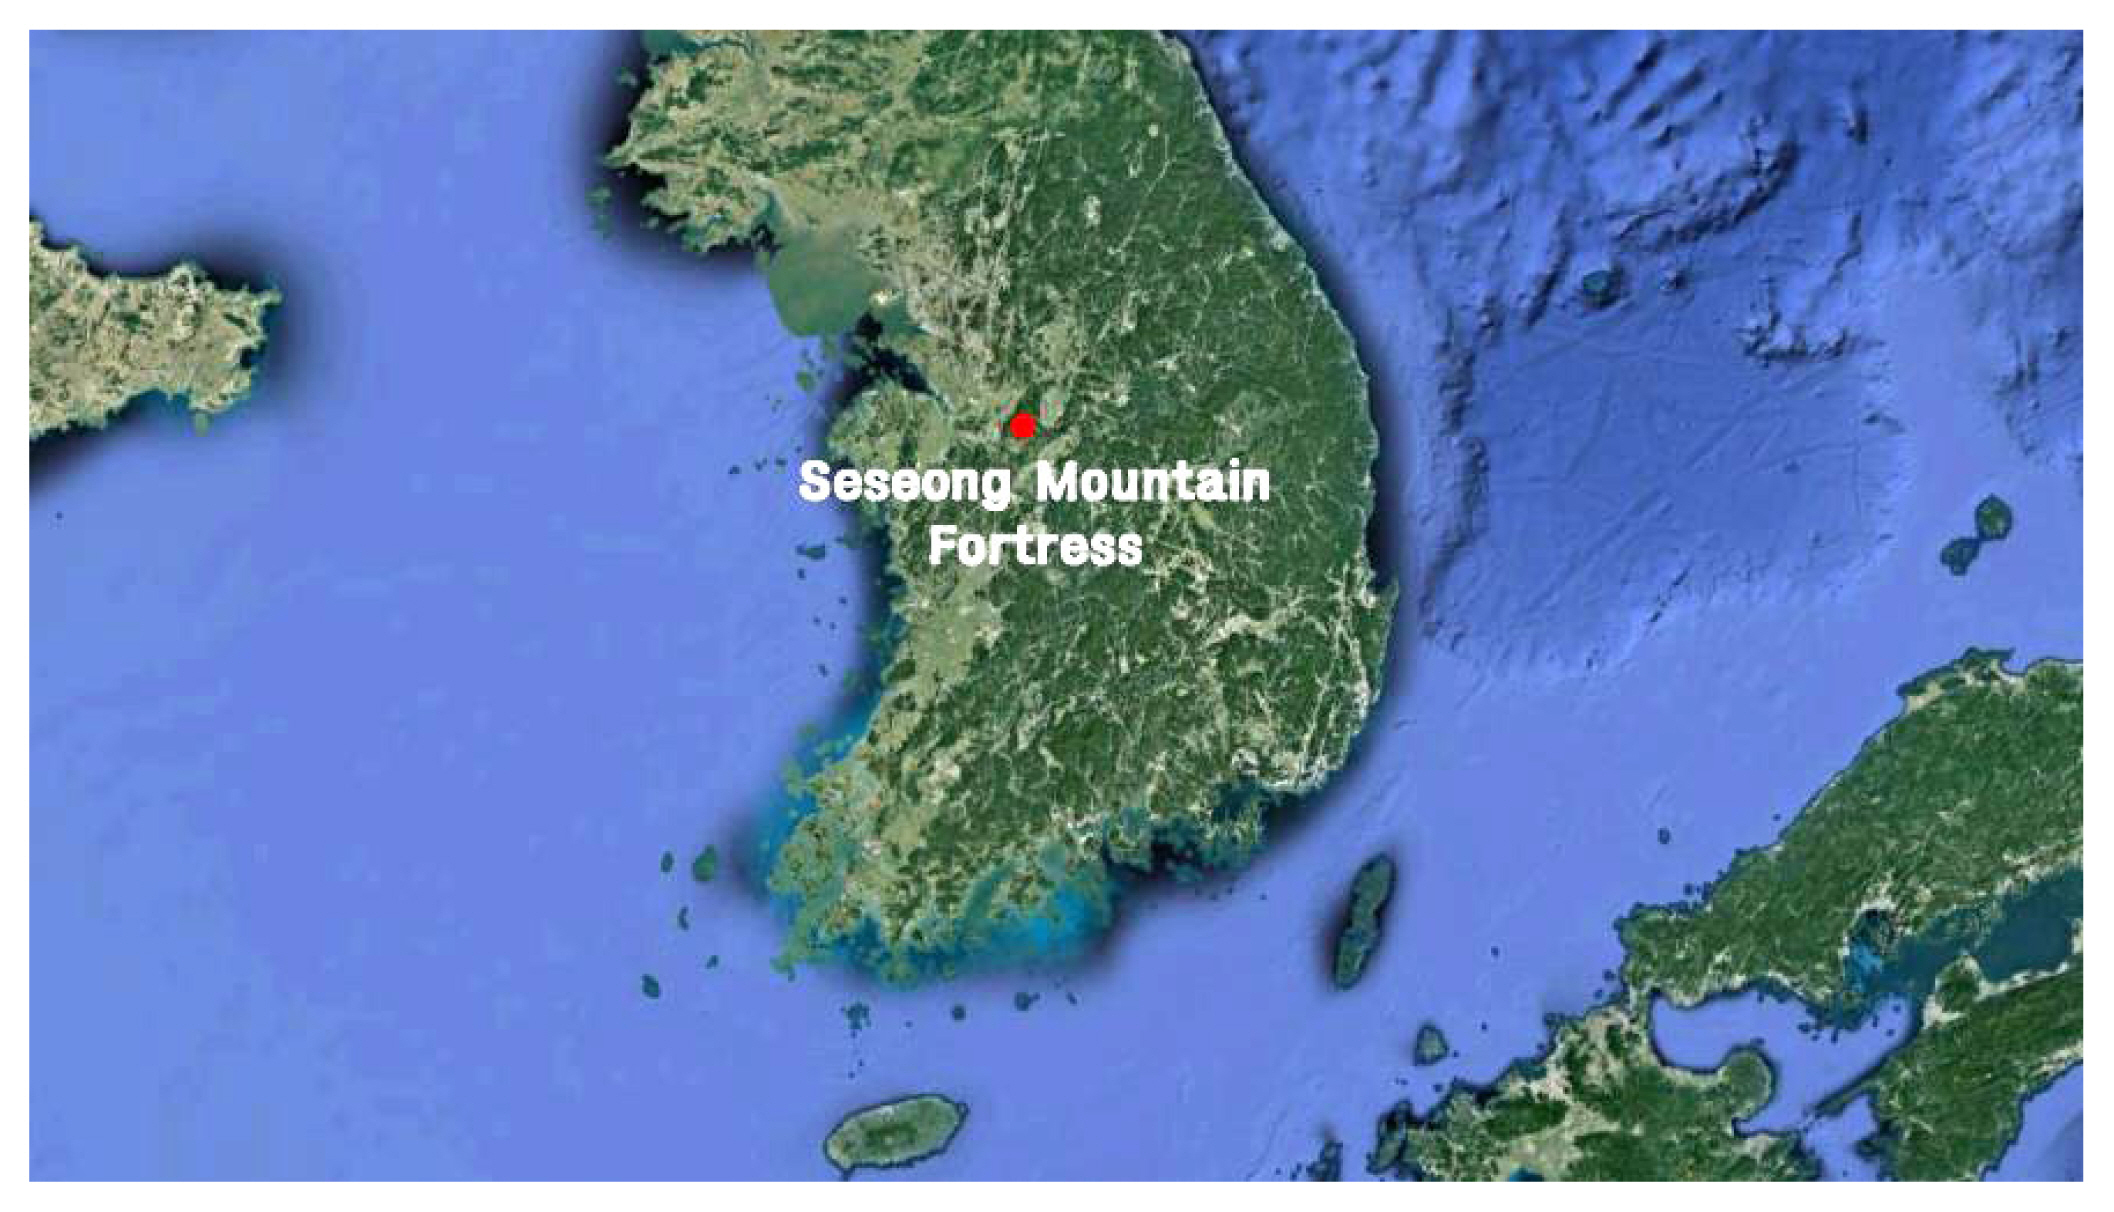
The archaeological site for analysis in this study is Cheonan Seseong Mountain Fortress. Cheonan Seseong Mountain Fortress is situated onSeseong Mountain, in Seongnam-myeon, Dongnam-gu, Cheonan-si, Chungcheongnam-do South Korea. It is a fortress built with a peak-banding style at the top of the Seseong Mountain. Earthenware from the Three Kingdoms period has been found at the site. 〈Fig. 1〉.
Cheonan Seseong Mountain Fortress is currently designated as City Monument No. 105, but no detailed archaeological survey has been conducted yet. There has been a report on the detailed field survey on this site,19 but no detailed archaeological prospection has been conducted to date. Owing to the fact that Korea has four distinct seasons, on-site surveys are limited to spring and early fall. Therefore, by introducing aerial LiDAR, remote sensing was carried out on the target site, Cheonan Seseong Mountain Fortress, and various image analysis techniques were applied to the acquired data.
The LiDAR photogrammetry in this study was conducted based on the Korea National Geographic Information Institute Notice 2009-950 Operational regulations of Aeronautical laser survey, and data from three reference stations implemented the Differential Global Positioning System (DGPS) technique to acquire accurate GPS location information. The analysis method and results are described as follows.
1) Analysis methods using aerial LiDAR and results
(1) Work process
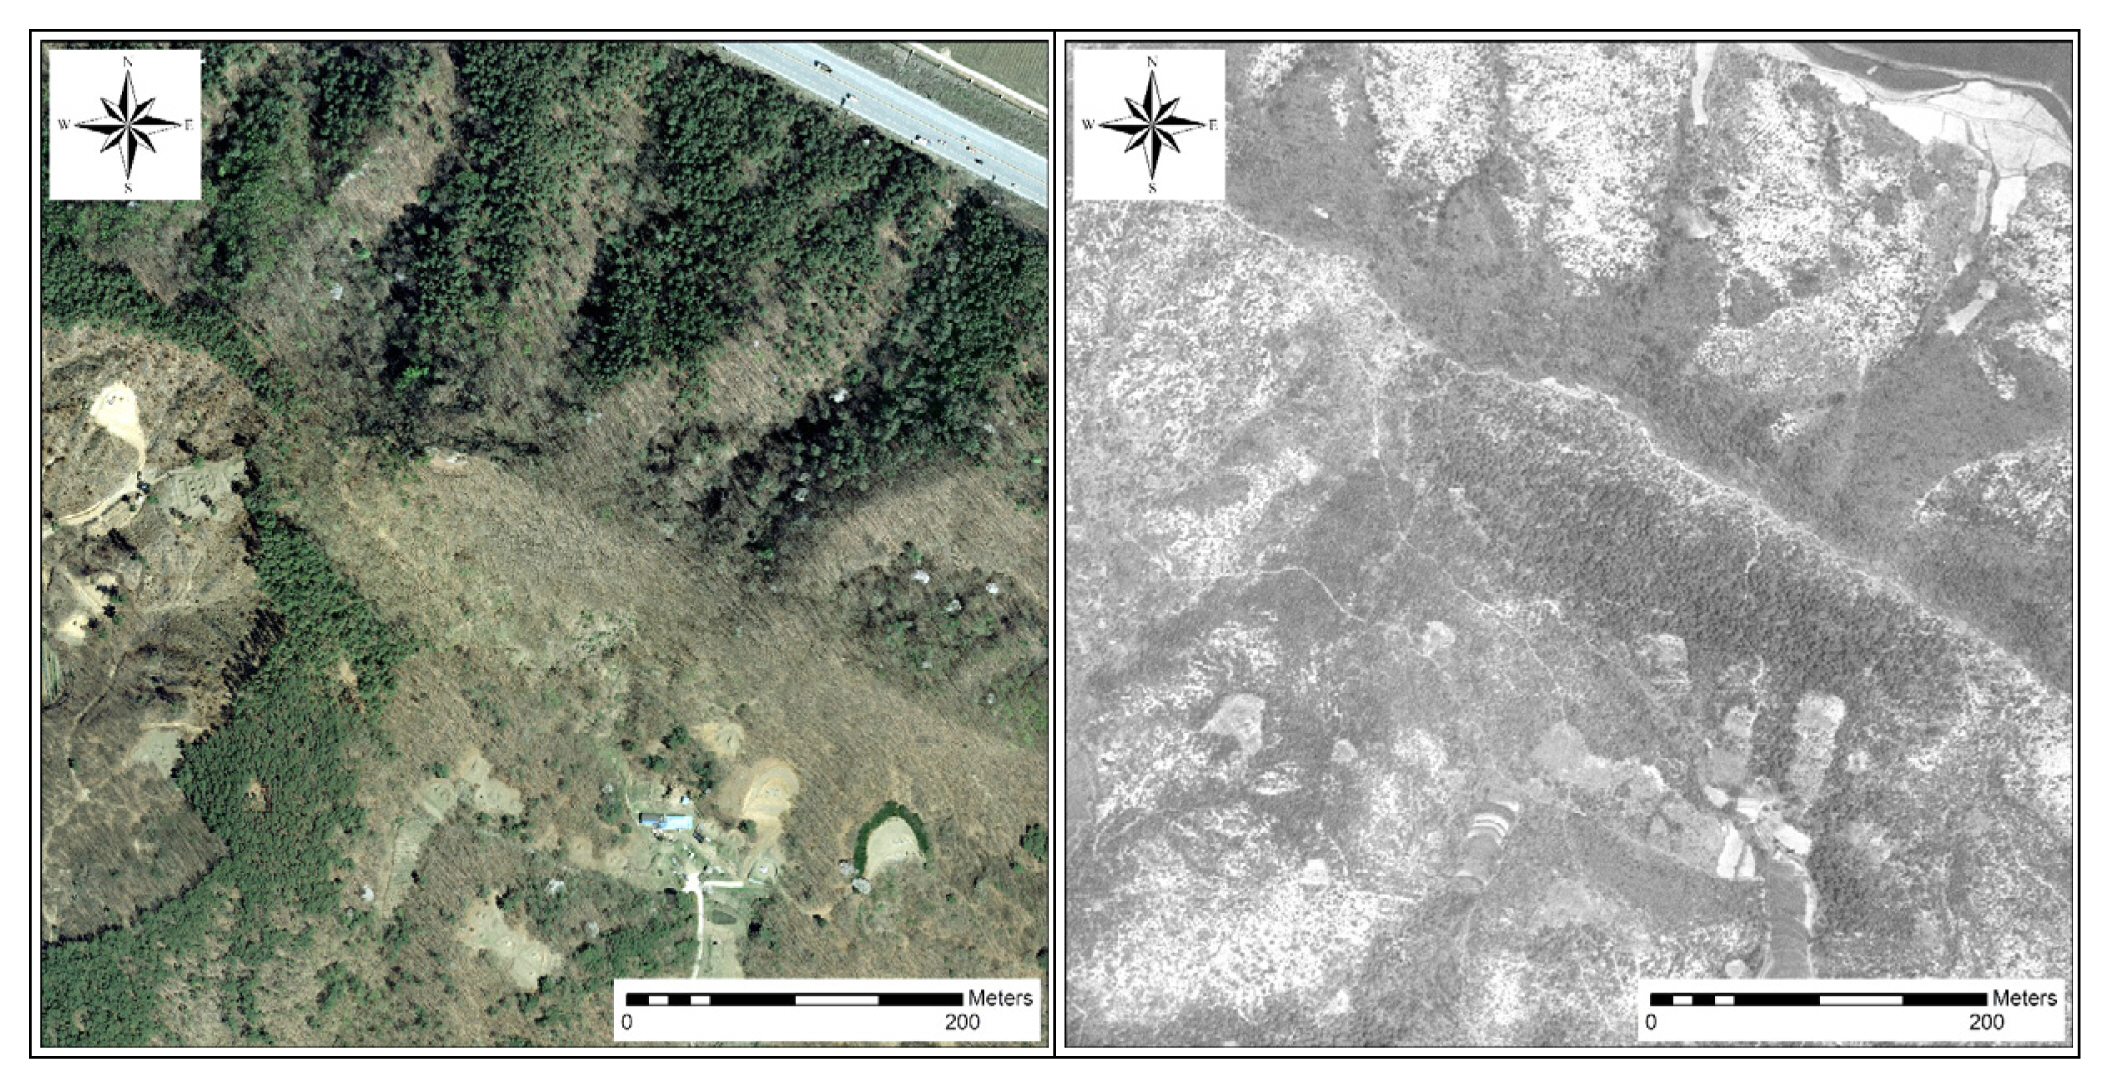
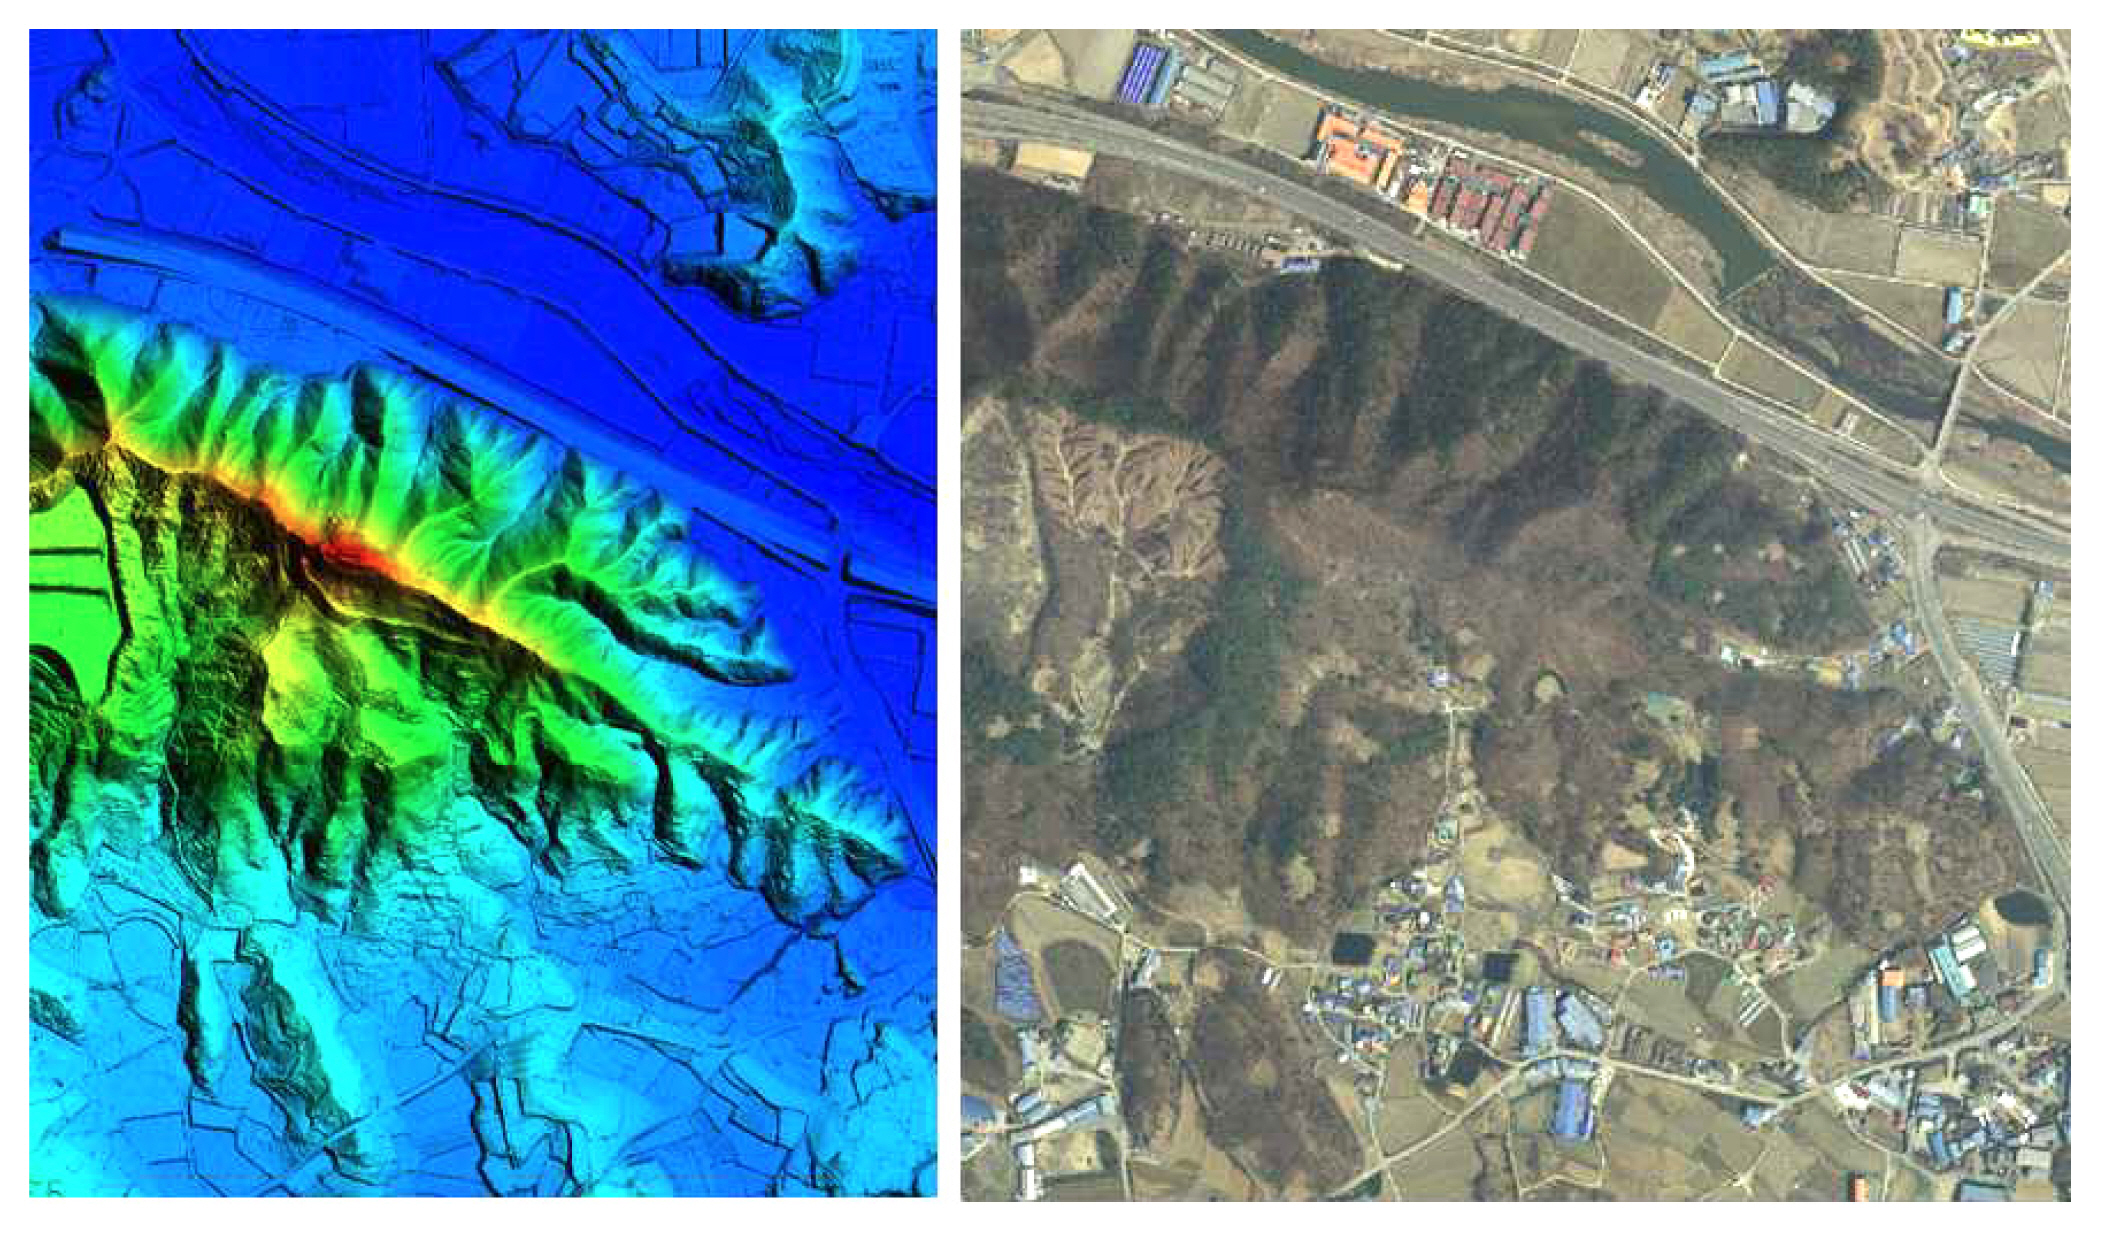
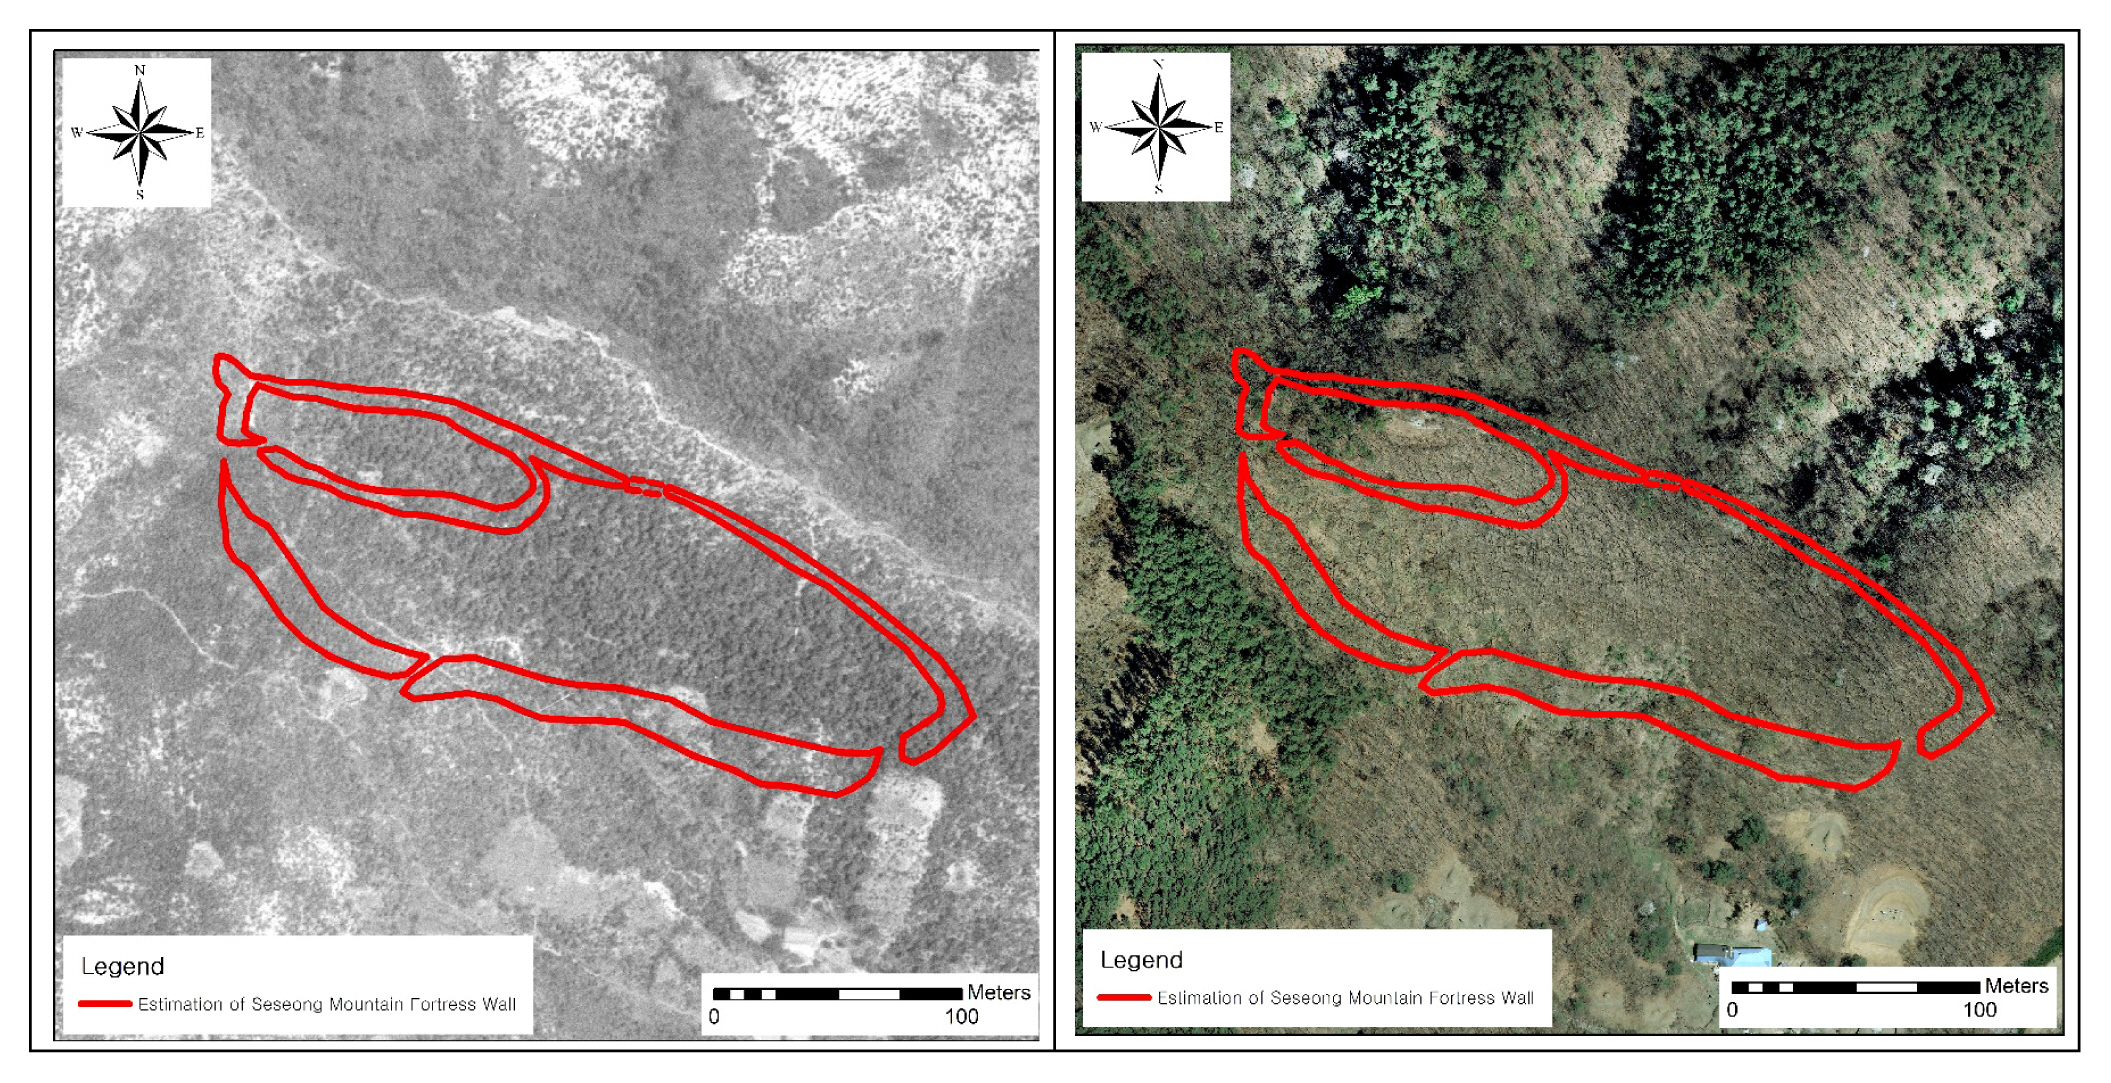
An ALS 60 LiDAR sensor was used to perform Aerial LiDAR surveying. The specifications of the equipment are shown in 〈Table 1〉. The target area for surveying was Seseong Mountain Fortress at 25, Hwaseong-ri, Seongnam-myeon, Dongnam-gu, Cheonan-si, Chung-cheongnam-do. Currently, traces of mountain fortress cannot be detected with a visual observation of aerial photos. This situation is the same for the aerial photo taken in the past. 〈Fig. 2〉.
To start the aerial LiDAR surveying, flight planning had to be set first. The course for flight and image capturing was planned in consideration of conditions such as laser point density, aircraft course direction and distance, and weather. 〈Fig. 3〉.
Aerial LiDAR filming was performed using a Cessna 208 Caravan aircraft. The work was carried out by CHUNG-ANG Aerosurvey with the support of Oh Kyu-Jin, Director of the Gakyung Institute for Archeology.
For accurate measurement of location, although accurate information for aircraft’s location can be obtained using the GPS/INS installed on the aircraft, regular reference station data were used for more precise determination of location. If the information of the aircraft location is processed with the DGPS technique based on the received GPS location information, more accurate information of the aircraft location can be obtained. Using this method, the exact location of the survey target area can be determined with accuracy and efficiency.
The coordinate system used in this study was Korea 2000 / Central Belt 2010 (EPSG: 5186).
The initial data acquired from the aircraft was carried out through GPS/INS processing, and finally, data in the LAS file format were created. The aerial LiDAR data extracted in this way provided values of limited information such as the coordinates of irregularly distributed 3D points and the intensity of echo signals for information on the earth’s surface. These data were automatically, semi-automatically, or manually classified through post-processing to obtain classified data with archaeological significance.
The Digital Surface Model (DSM) is the earliest stage data obtained by aerial LiDAR surveying. The data obtained from aerial LiDAR were processed for creation in the form of regular grids through an interpolation method for improved accuracy such as a Triangulated Irregular Network (TIN), kriging interpolation, or cubic interpolation.
Then, the LiDAR data were separated into ground and non-ground points data to create the digital elevation model (DEM) 〈Fig. 5〉. This process is referred to as filtering.
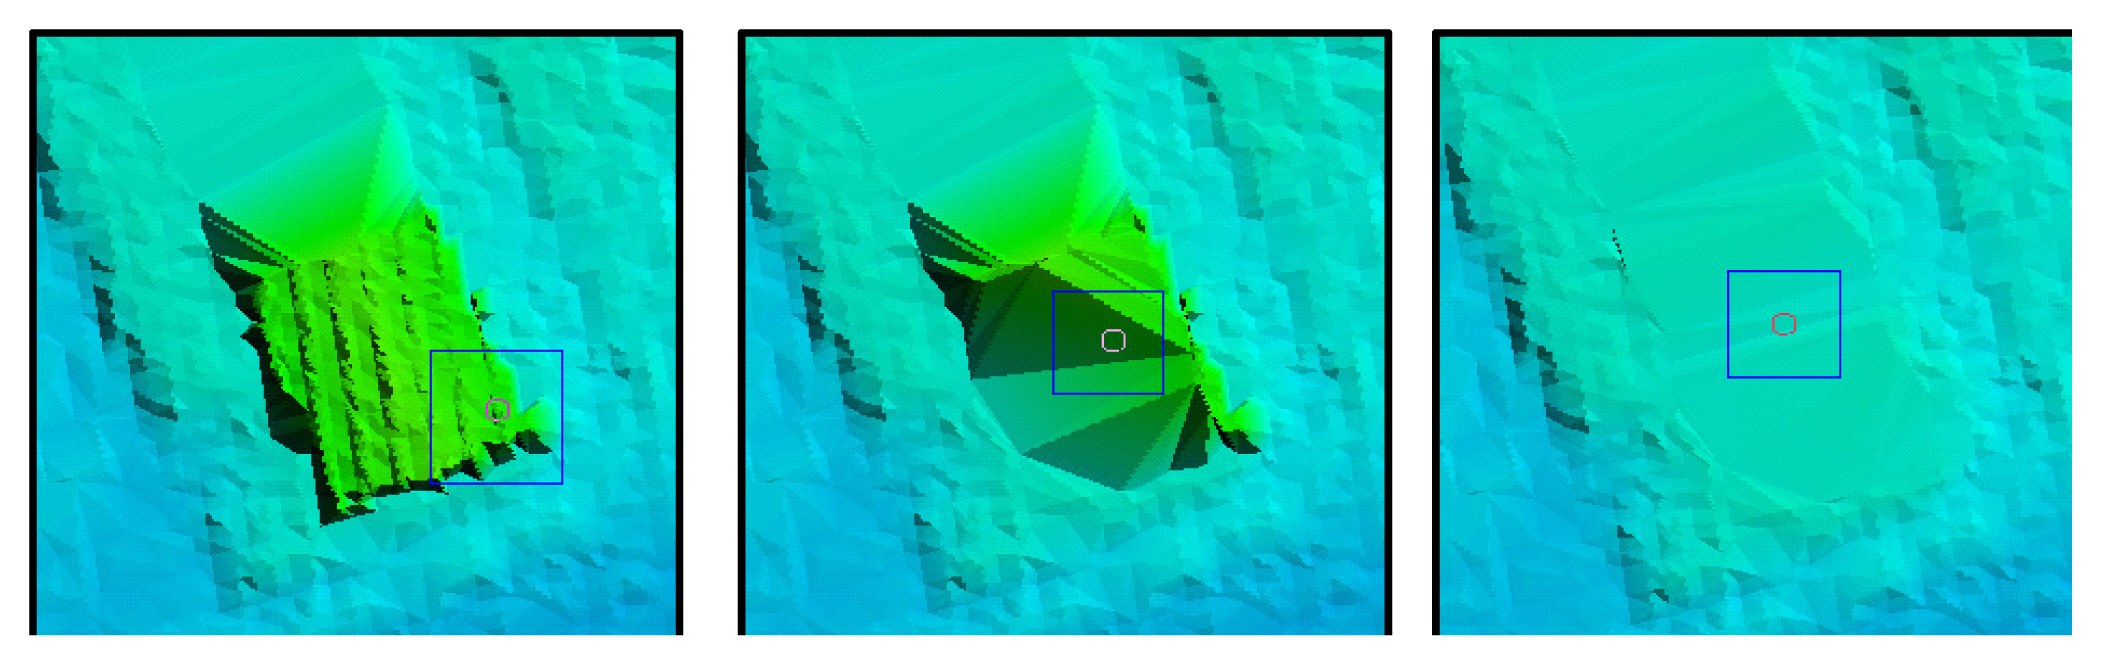
In DSM, filtering refers to the work of removing point data corresponding to above-ground features whose surface height is different from the ground level, such as artificial objects and vegetation. Filtering can be conducted automatically or manually, but manual filtering is performed for features that are difficult to classify automatically 〈Fig. 6〉. The Digital Terrain Model (DTM) produced through this filtering process can be divided into the removed above-ground features and bare earth 〈Fig. 6〉.
Then, as for the final completion, The DEM was visually checked and inspected on the screen, and errors were identified and corrected. After completing this process of testing the accuracy of the information, the final output was derived. The process of this work was outlined in 〈Fig. 7〉.
(2) Results with further analysis with visualization
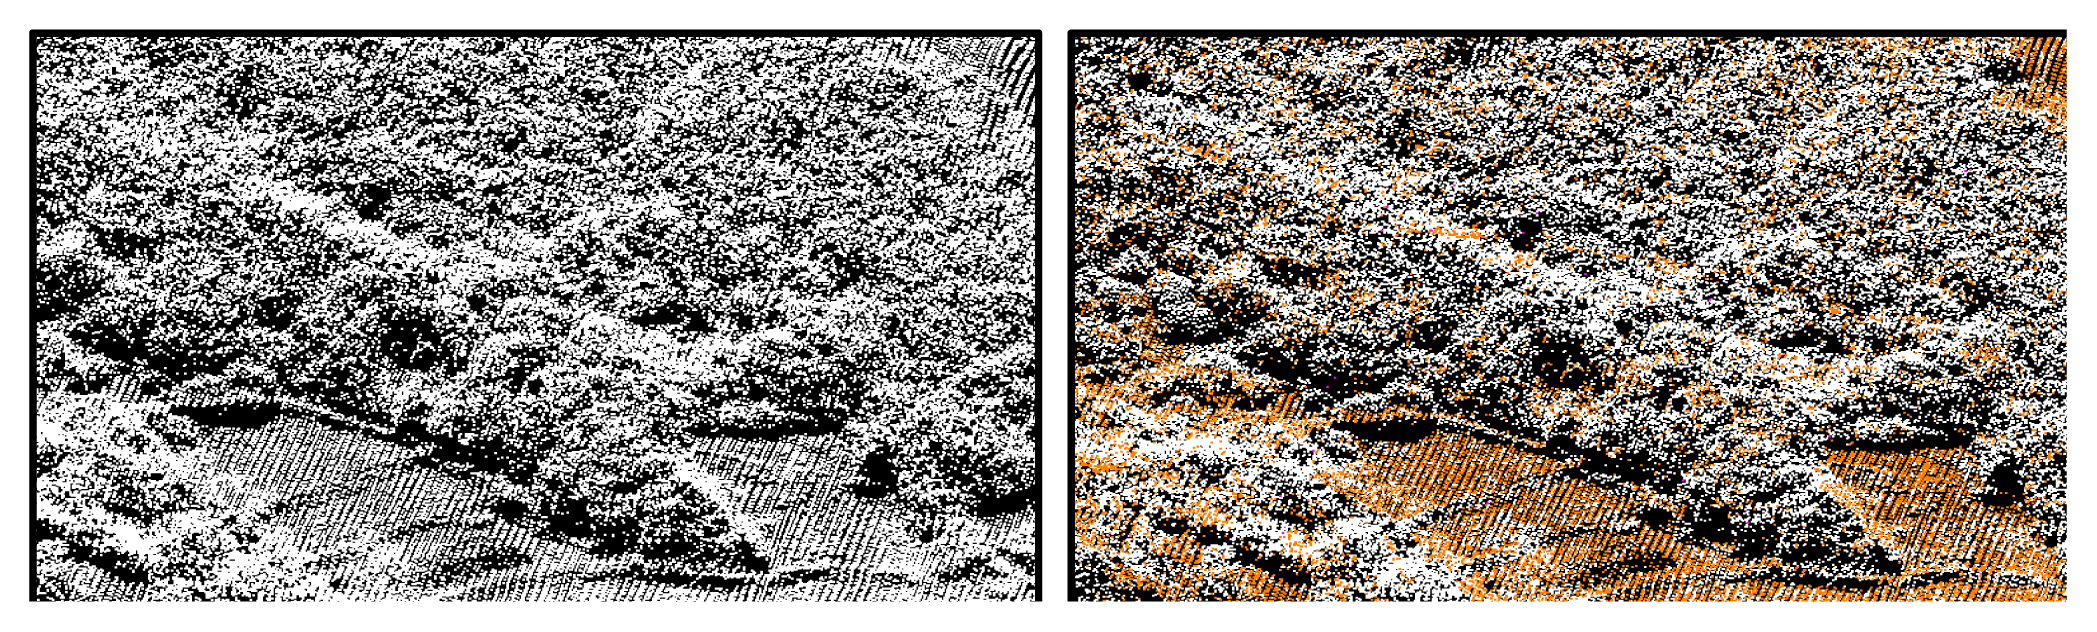
〈Fig. 8〉 depicts the analysis result and 〈Fig. 9〉 the 3D map based on the American Standard Code for Information Interchange (ASCII), which is a character encoding standard for electronic communication based on the Roman alphabet as used in modern English. It is used to display X, Y, Z coordinates in LiDAR. The details of the ground surface that were covered and hidden by the forest can now be observed. The appearance of the Seseong Mountain Fortress wall is now visible, although it is still faint.
For further analysis, various visualization techniques were used. Data were created in various formats such as GeoTiff, ASCII, las, and DEM using the referenced data. Analysis and interpretation were carried out manually, and the tool used was ArcGIS.
First, basic steps of surface analysis such as elevation map, aspect map, and slope map were carried out using LiDAR data. As a result of the analysis, the shape of the target mountain fortress is observed in individual images.
In the elevation analysis for the site, the mountain fortress was built on the ridge around the highest peak 〈Fig. 10〉. The shape of the wall stretching from the northwest takes the form of a narrow oval, and it is inferred that the wall was built from the northwest to the southwest in a longitudinal direction surrounded by an elevation in the range of 190m – 220m. The shape of the walls to the east, west and south can be observed in detail. However, the boundary of the wall to the north is not clear compared to other walls.
In the aspect analysis, most of the interior part of the mountain fortress is oriented southward. The part assumed to be a part of the fortress wall shows a different aspect from the interior part of the fortress wall oriented southward. The west side of the estimated fortress wall is oriented southward, and the orientation of the south side is a mixture of southeastward, southwestward, and westward. The east side of the estimated fortress wall is observed to be mainly southwestwardly oriented. The fortress wall, which was not presented clearly in the elevation map, was confirmed to be oriented southeastward, eastward, and southwestward.
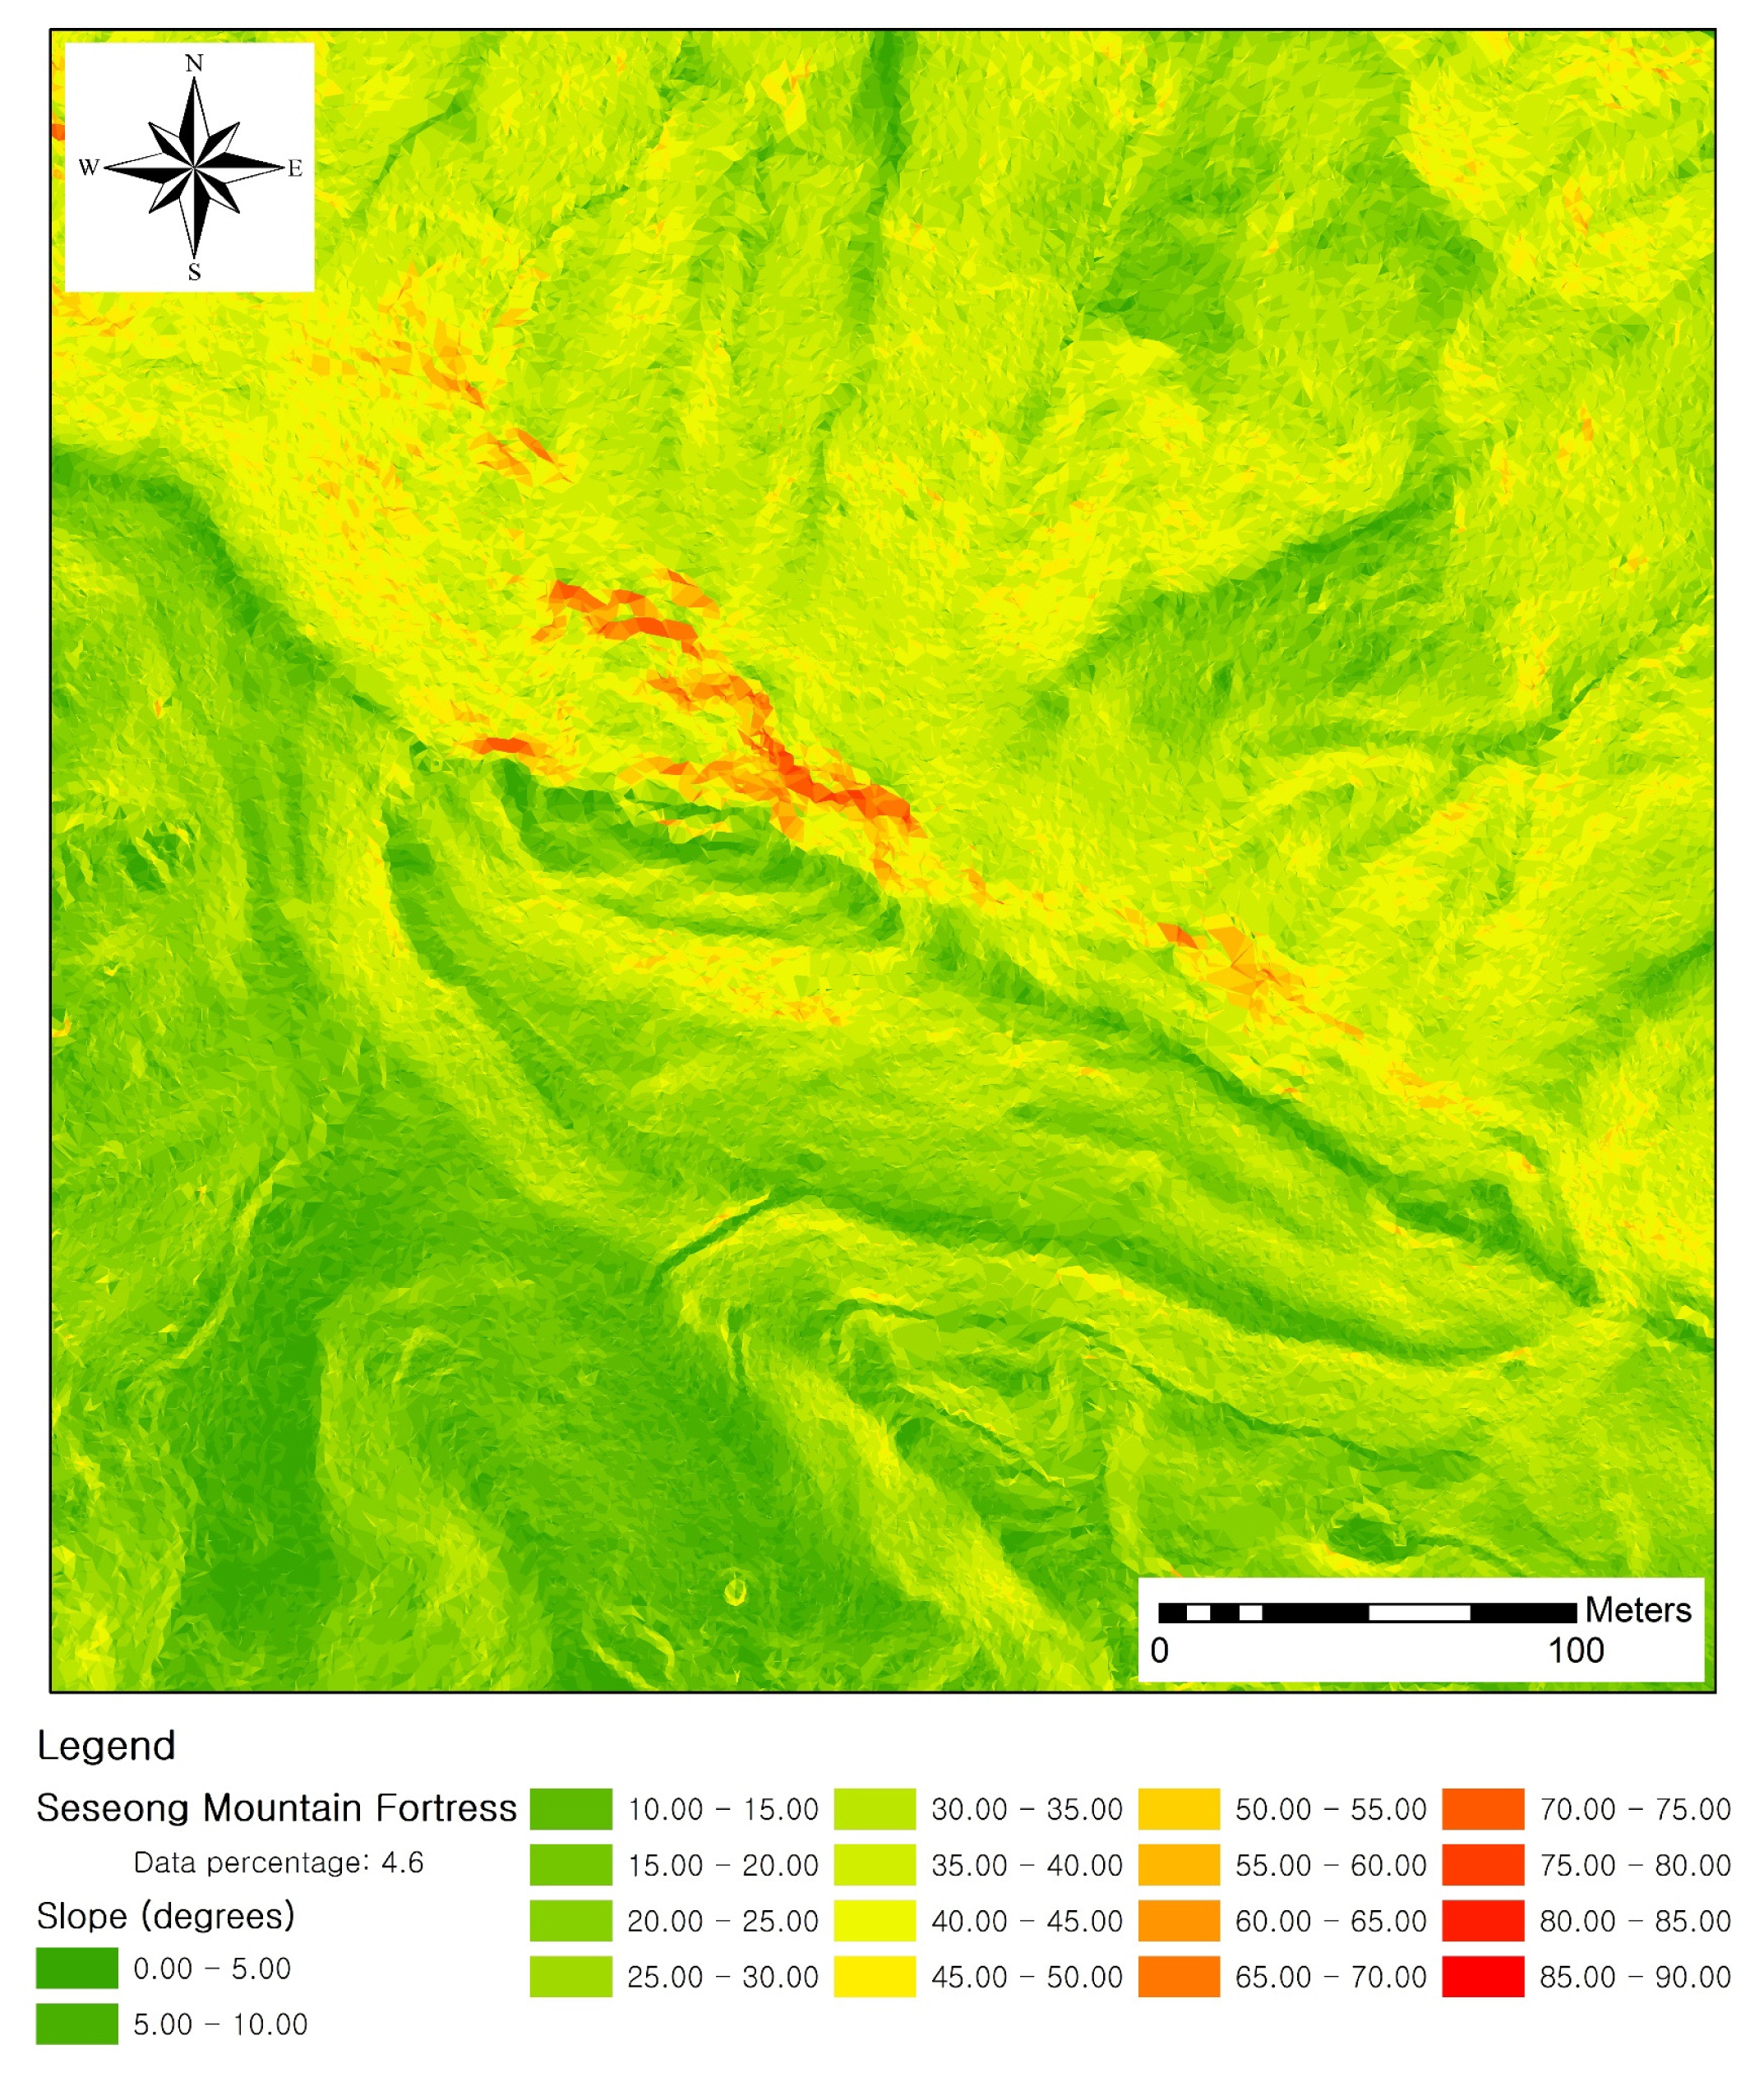
〈Fig. 12〉 is a slope map of the analysis area. In the slope analysis, a clear representation for the detailed shape of the fortress wall was confirmed. The slope in the area ranges from 0° to 90°. Legends were created at 5° intervals for the visualization. The slope for most of the interior part of the fortress wall ranges between 0° and 30°. Some parts with high elevation and the area estimated to be parts of the fortress wall have slopes of more than 30°.
〈Fig. 13〉 is a slope map produced by resetting the slope classification with 30° as the reference angle. The slope in most of the area inside the fortress is below 30°. The parts that are estimated to be the summit of the mountain, ridge and fortress wall show slopes that are ≥30°. In general, a slope of ≥ 30° is classified as a cliff in geomorphology.20
Most of the slopes around the area presumed to be a part of the north side of the fortress wall, which is not clearly represented in the elevation map or aspect map, are ≥30°. Therefore, most of the area estimated to be a part of the north side of the fortress wall and its surrounding area are judged to be a cliff. In particular, the north side is connected to the curved part around the Seseong Mountain Fortress and shows a steep slope. Considering these characteristics, the northern fortress wall seems to be an advantageous area compared to other parts of the fortress wall in terms of defense with cliffs in the surrounding areas. One point to note is that because of the steep slope, it is possible that the fortress wall was damaged or lost from different artificial and natural influences in later eras. Therefore, this might have led to the unclear presentation of the area in the elevation map and aspect map. However, since the boundary between the cliff and the fortress wall is clearly visible in the slope analysis, there should be no problem in assuming this place as the north side of the fortress wall of Seseong Mountain Fortress.
With basic surface analysis based on GIS alone, it is possible to visually observe and estimate the shape of the fortress wall and the shape of the surrounding topography. However, additional analysis is needed for observation of the detailed shape of the terrain and verification of the data obtained from visualization.
Next is an analysis using (the) DEM and hill shading maps. In general, hill shading or relief shading is a method used in general digital cartography, with slopes shaded to achieve a realistic representation of the actual terrain and express topographical shapes with highs and lows. The map is produced based on the elevation data in the form of raster data21.
The hill shading map created on the computer provides visual representation of the shading effect according to the elevation of the terrain; thus, the three-dimensional map ensures visual representation of the elevation in 2D surface. The map allows for a natural expression of the topographic shape in relief form by setting the azimuth angle of the sun and the angle on the horizontal plane.22
In Europe, where research using LiDAR has advanced, a range of visualization techniques are employed to verify the study area. The accuracy of the remote sensing method using LiDAR is improved through cross-validation of the archaeological features that are observed in different visualization maps and images produced by these different techniques.23
In this study, a number of visualization tools were used to visually verify the terrain and archaeological evidence around the study area, Seseong Mountain Fortress. Through application of image filtering on the pixel values of an image, natural and artificial boundaries in the image were detected and inaccurate data were removed to improve clarity or the quality of raster image data, and more precise analysis could be achieved.
In particular, a variety of image filters were applied to enhance the effect of visual detection by emphasizing the edge lines of the fortress wall that were not visualized. The purpose of using multiple filters for improved edge detection is to visually check and examine the archaeological data for a specific area several times. In this paper, the filters were used to observe the shape of the fortress wall.
ArcGIS 10.8 was used for analysis. The description of the image visualization and filtering techniques used are summarized in 〈Table 2〉. The results of images after application of filters are shown in 〈Figs. 14–18〉.
First, in DEM, optimal stretch value was applied using dynamic range adjustment (DRA), then a hill shading map was produced, followed by the application of various filters for visualization. The overall shape and edges of the fortress wall were also observed in the hill shading map, but for additional observation and comparative analysis, a range of image filters for edge emphasis were used to improve edge detection.
Gradient type filters showed many different results by adjusting the image intensity and directional change of colors. In particular, the overall edge lines of the fortress wall were more clearly shown in the south gradient, northeast gradient, and northwest gradient filters than other filters.
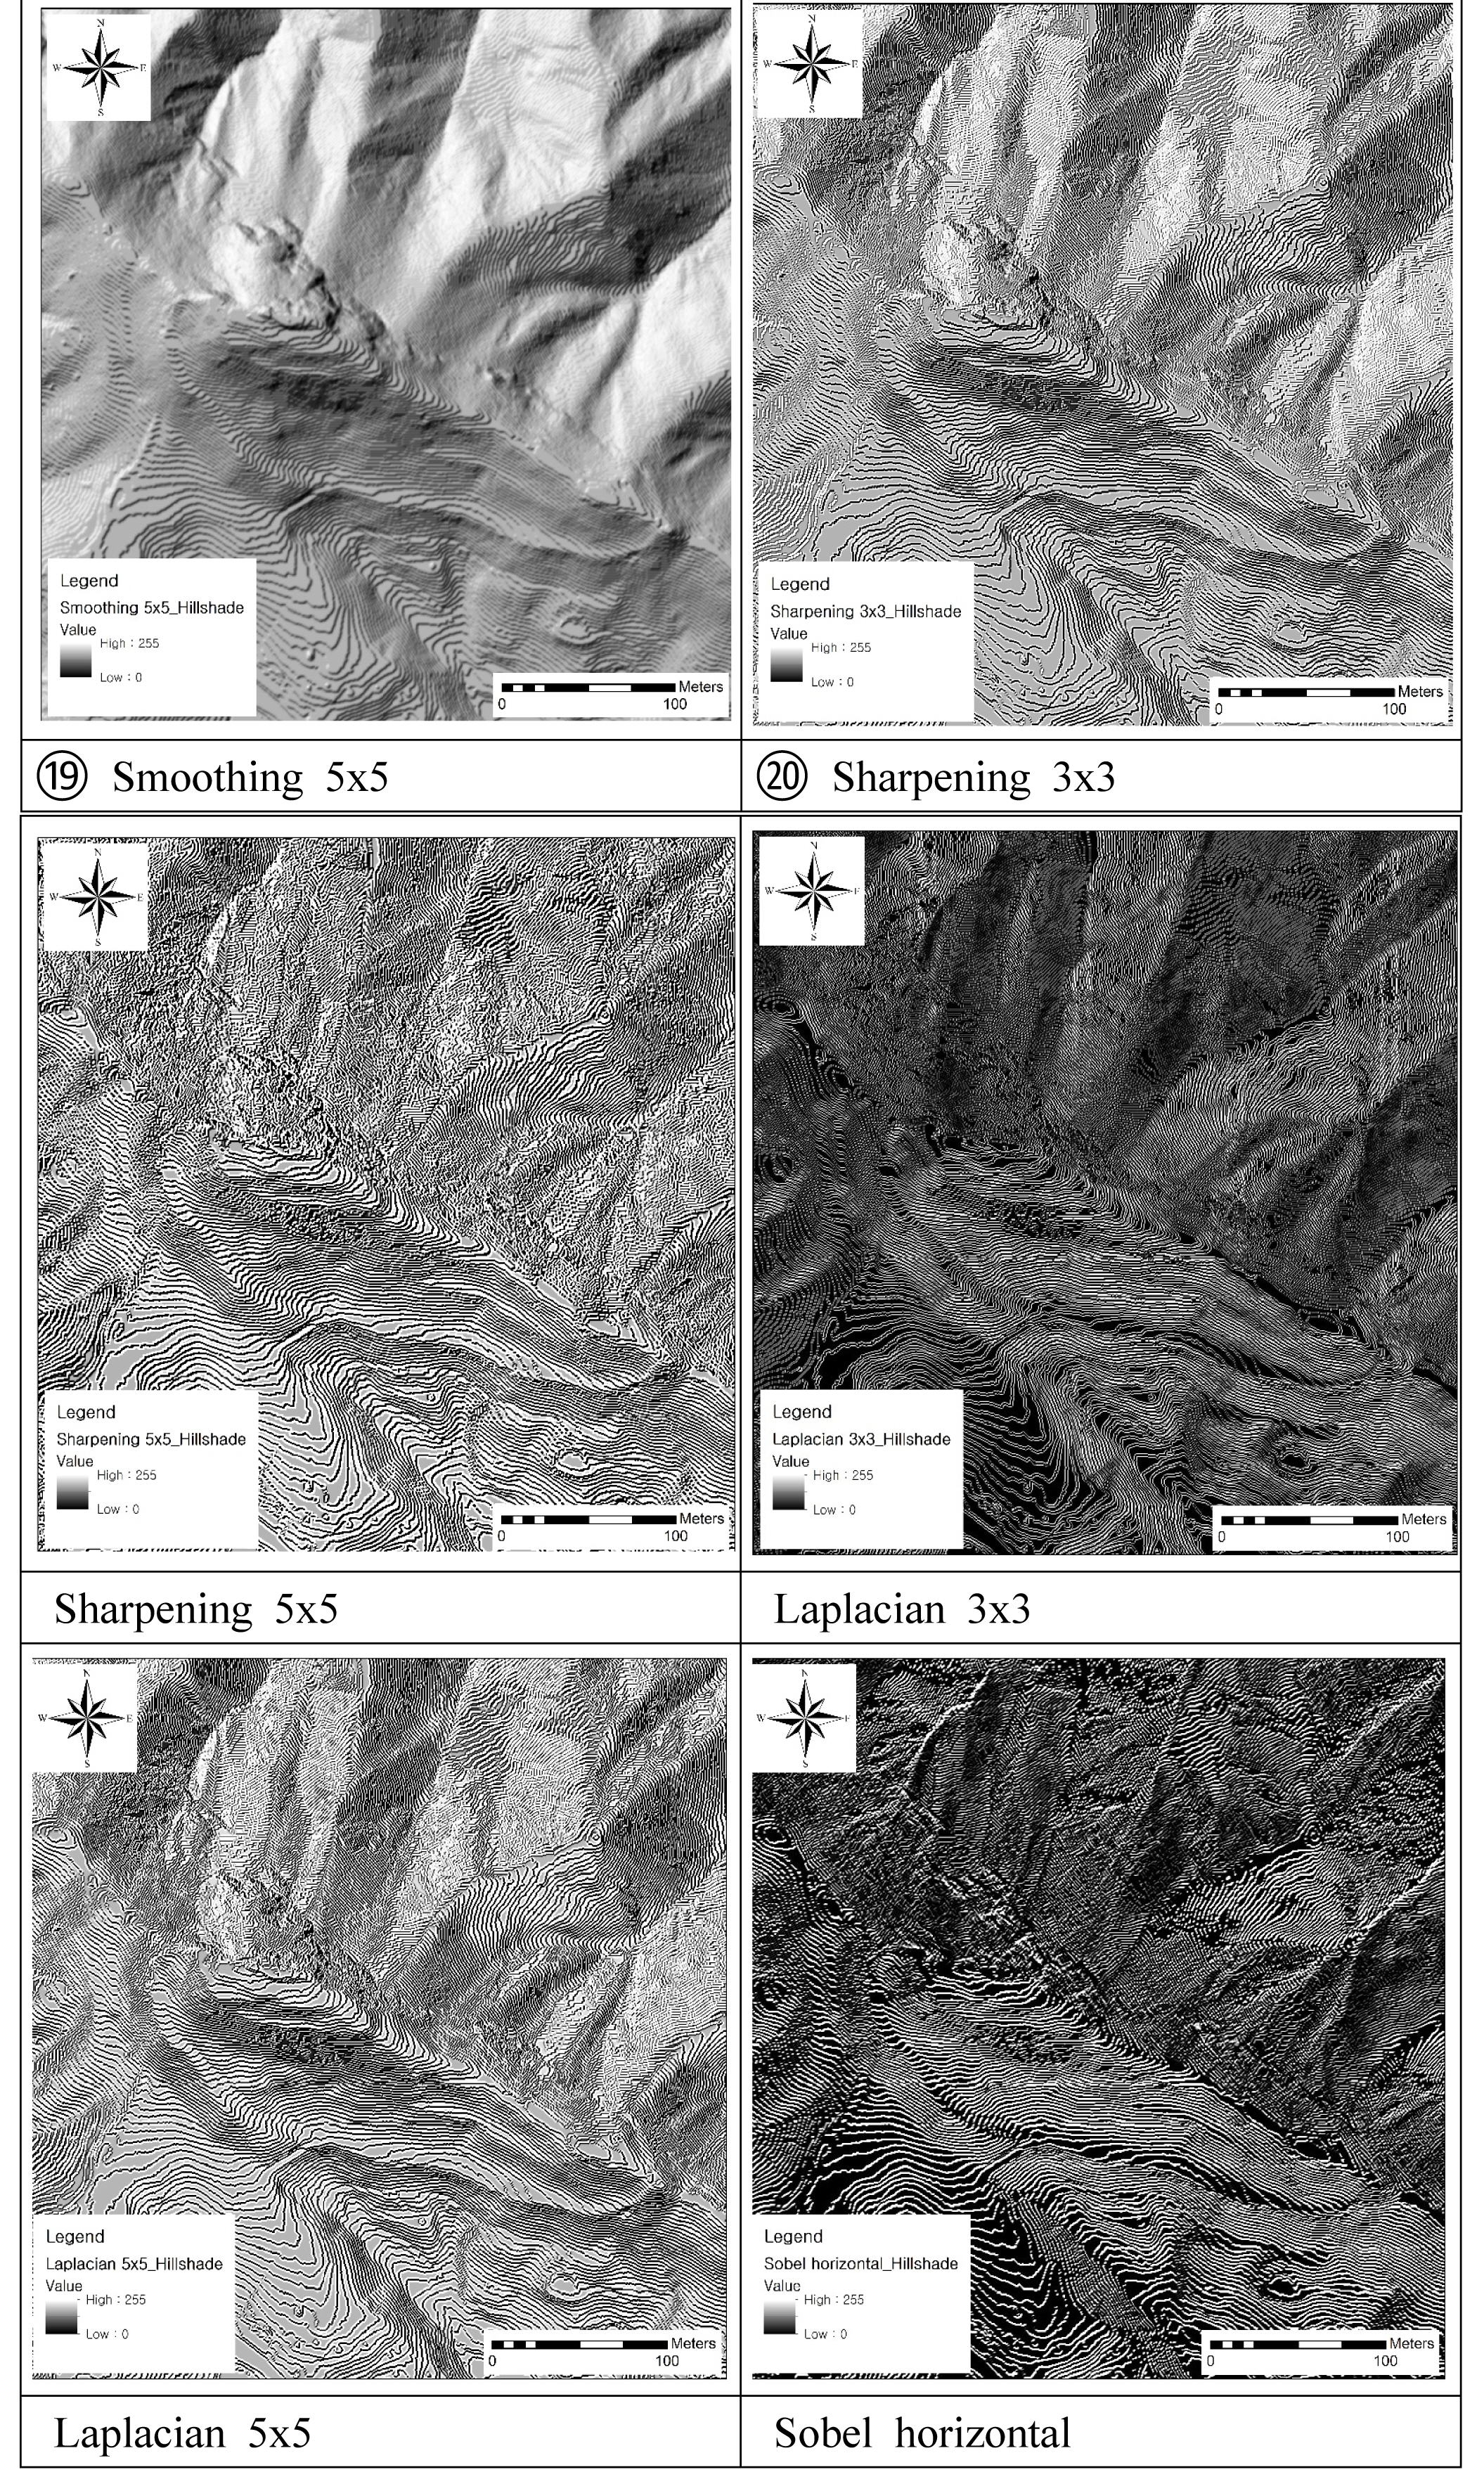
In the case of Laplacian type filters used for edge emphasis, the overall terrain and fortress wall were observed more clearly with the Laplacian 5x5 filter than with the Laplacian 3x3 filter when viewing the resulting image at a small scale. However, when zoomed in for analysis at a large scale, the Laplacian 3x3 filter provided more detailed information about the fortress wall shape.
The filters of line detection types have more detailed boundaries than other filters. Among them, the line horizontal filter was relatively easier to observe with naked eye than filters of other line detection types.
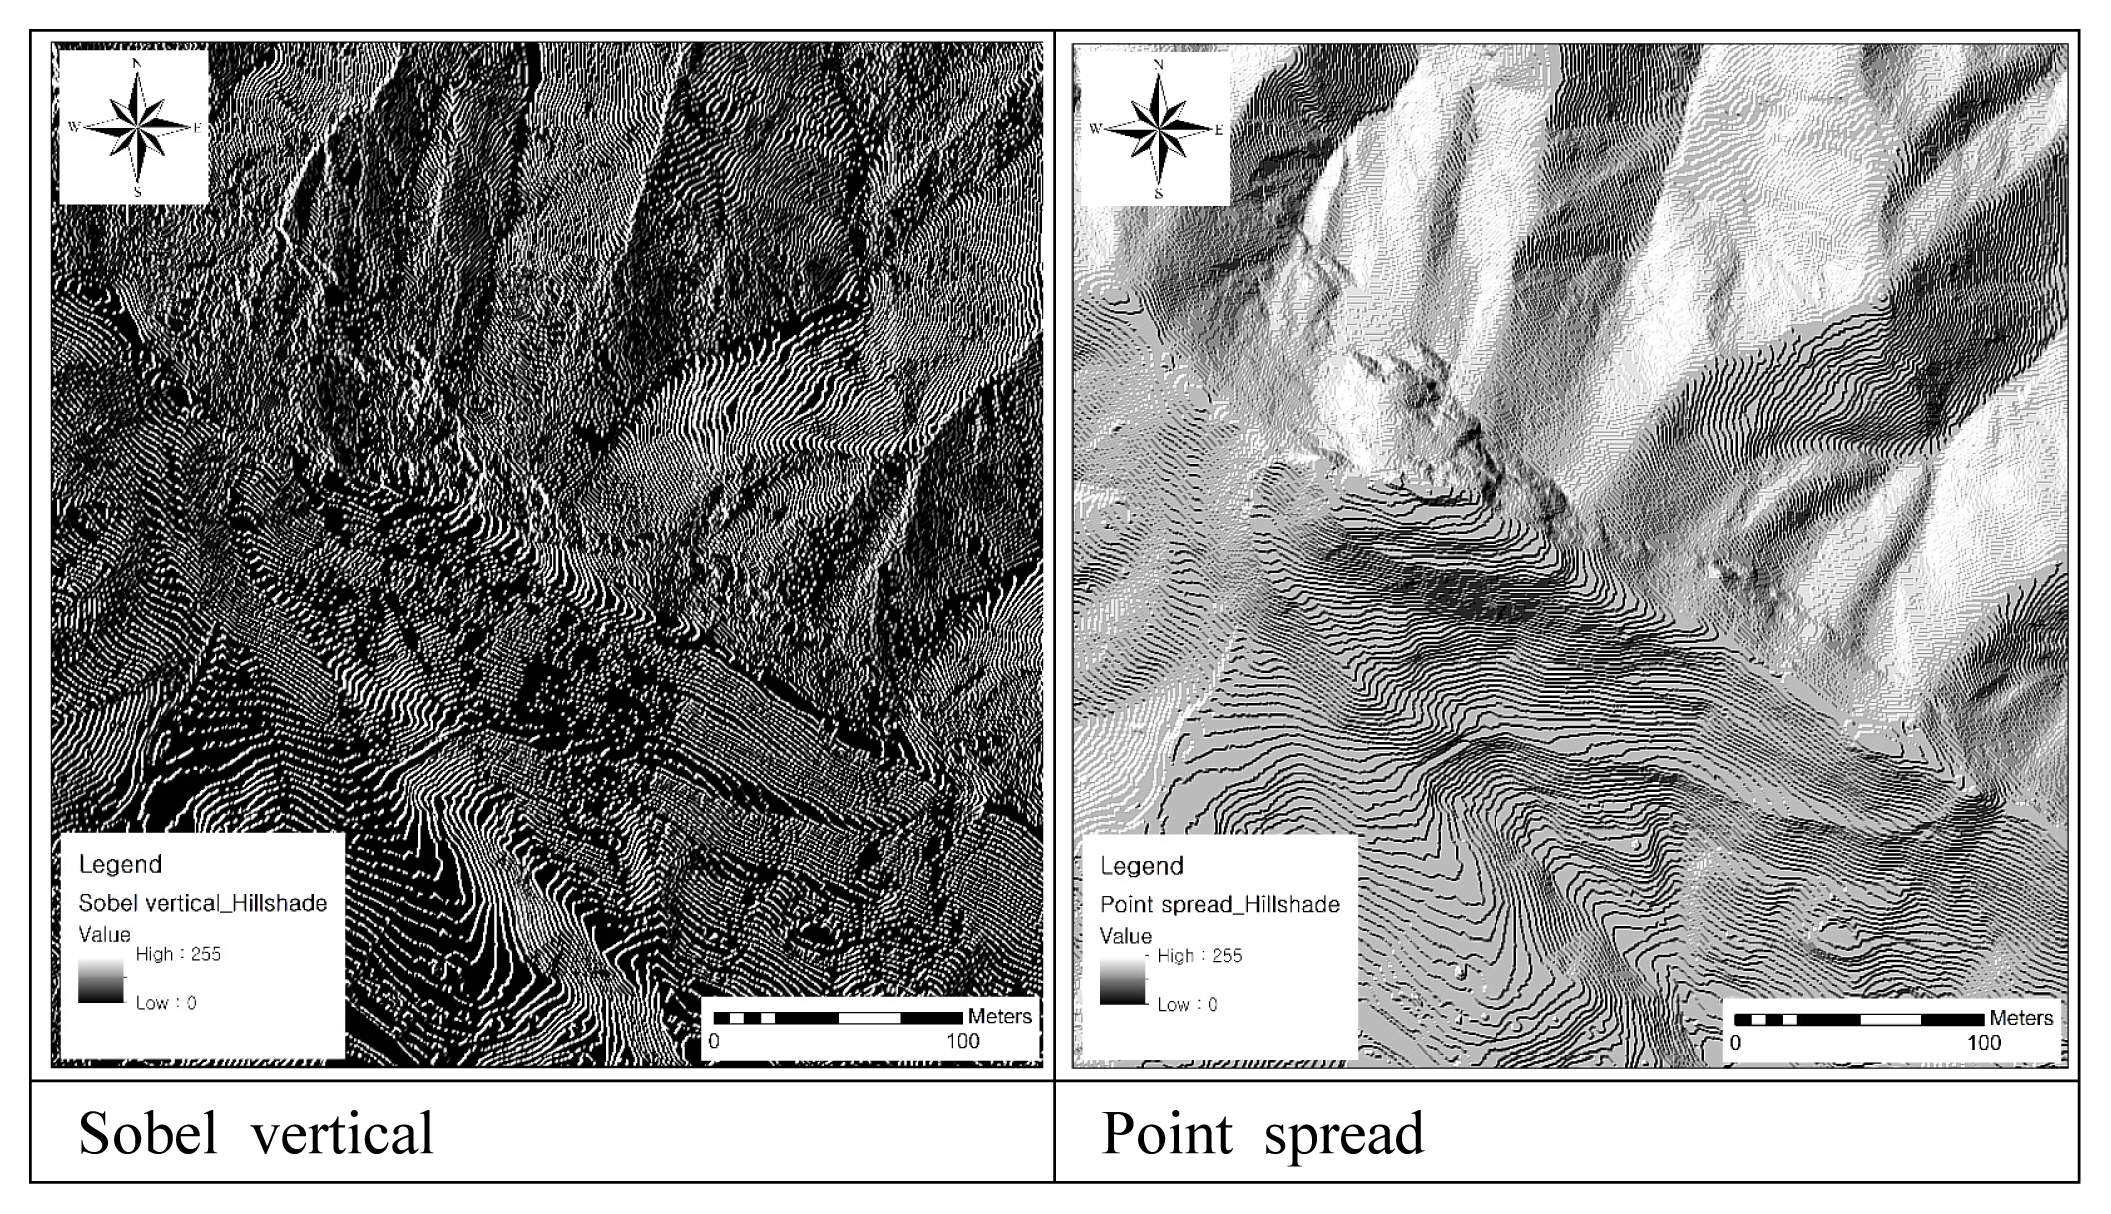
The image obtained from applying a Sobel type filter showed clear edge emphasis, and a Sobel Vertical filter provided more information about the fortress wall shape than a Sobel Horizontal filter.
Sharpening type filters provide a good visual representation of the elevation of the entire terrain. In particular, the shape of the terrain is presented more clearly by using a Sharpening 3x3 filter than using a Sharpening 5x5 filter. Smoothing type and point spread type filters showed almost similar results to the hill shading map.
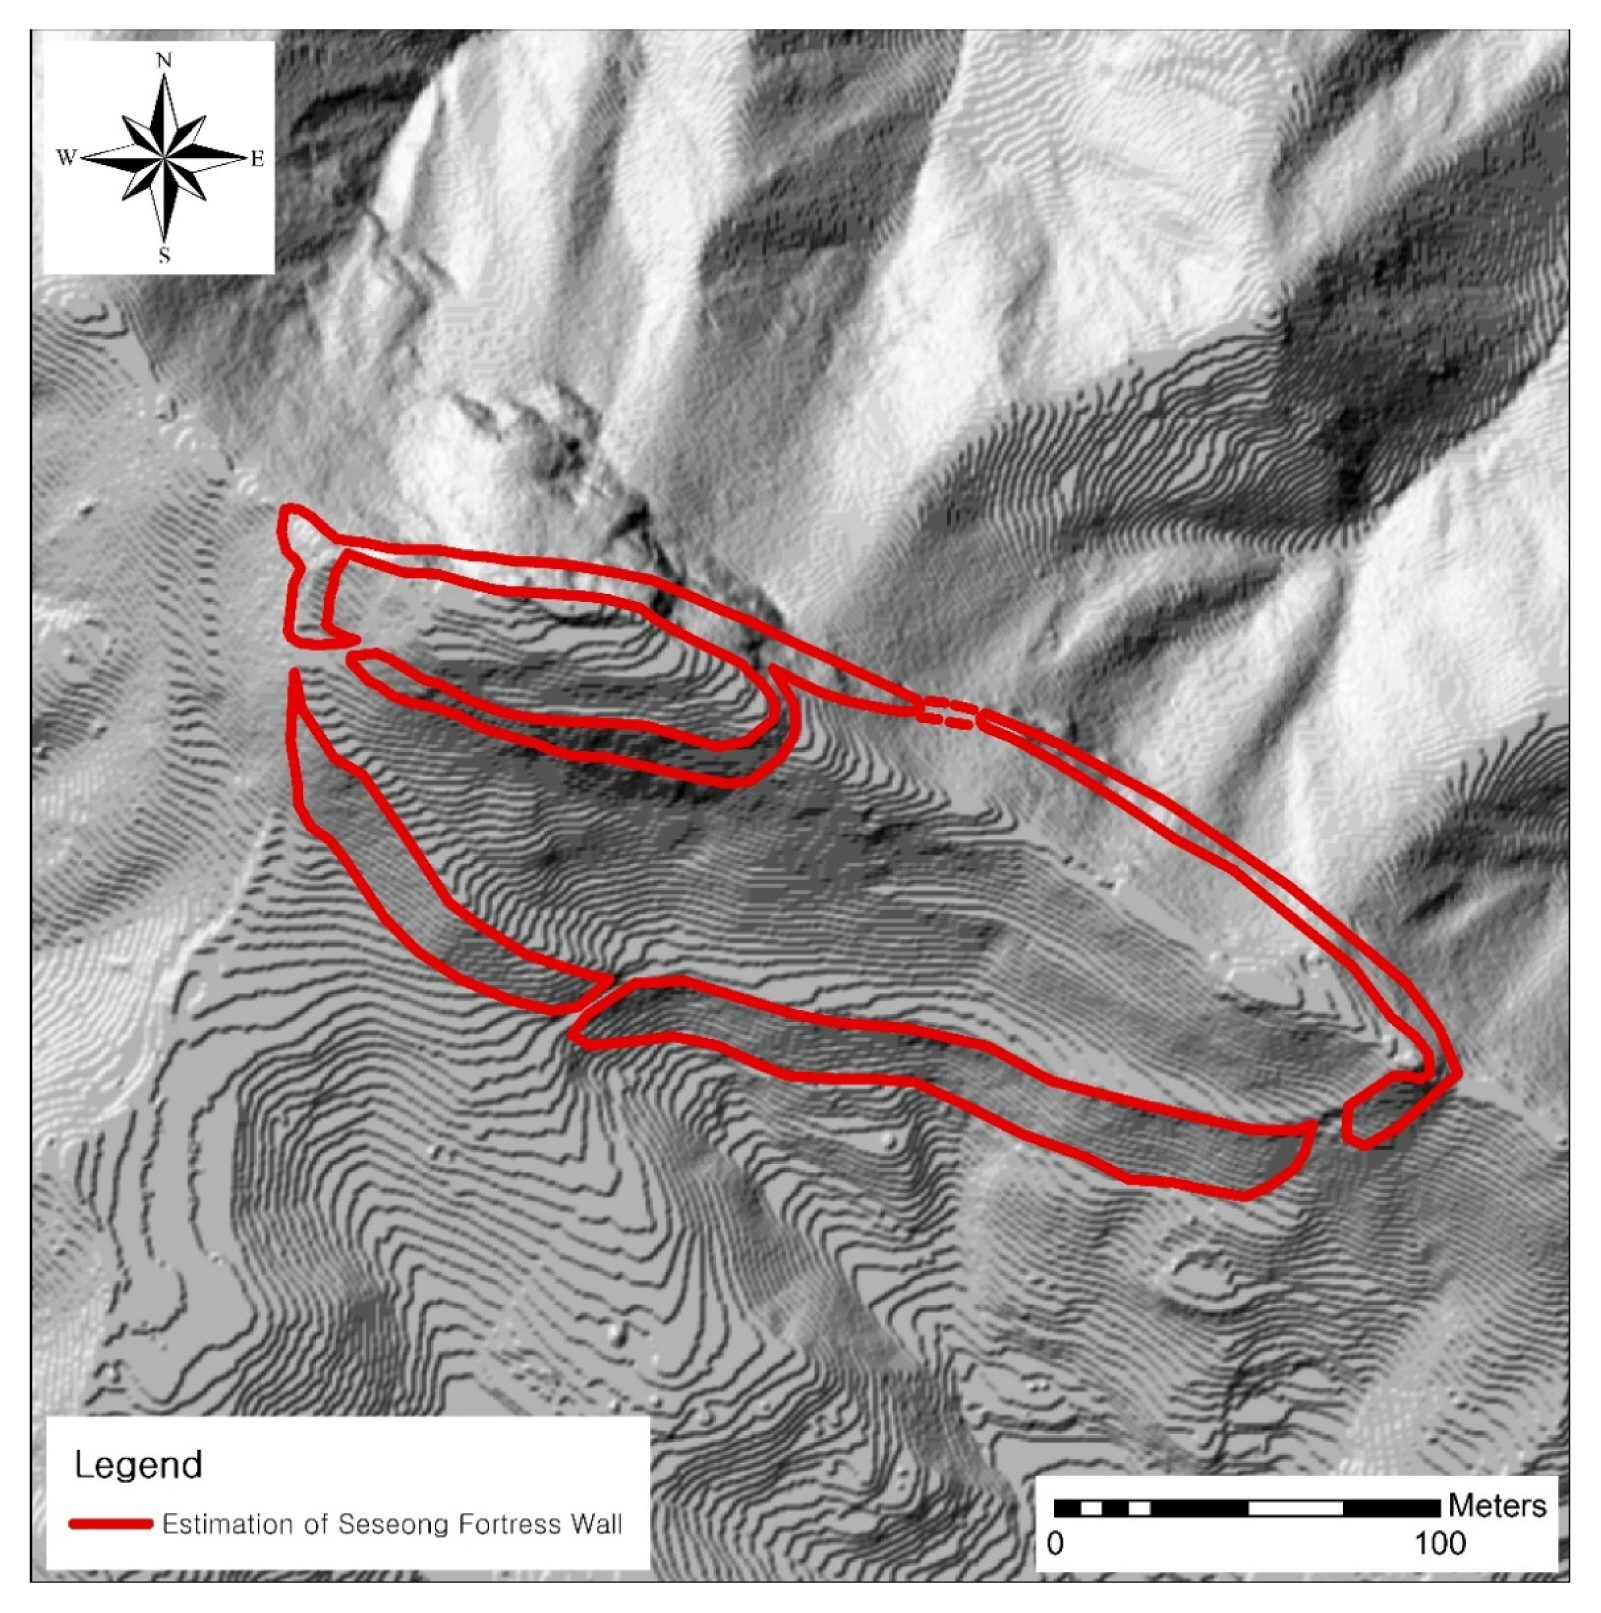
As a result of visual observation and the application of various image filters, the detailed shape of the Seseong Mountain Fortress wall, for which only rough estimation was obtained from the elevation map, aspect map, and slope map, was confirmed. In particular, overall, when the 3x3 pixels were applied rather than the 5x5 pixels, more detailed shapes of fortress walls and topographic shapes could be observed. One point to be noted is that when the 3x3 pixels were applied to the image, more noise appeared than the case of using 5x5 pixels in the analysis result. When analyzing other areas in the future, we need to take note of this difference and apply filters of 5x5 pixels or 3x3 pixels based on the situation.
The analyzed results from various image filters and the surface analysis results were superimposed for comparison, and as a result, significant information regarding the fortress wall shape could be visualized.
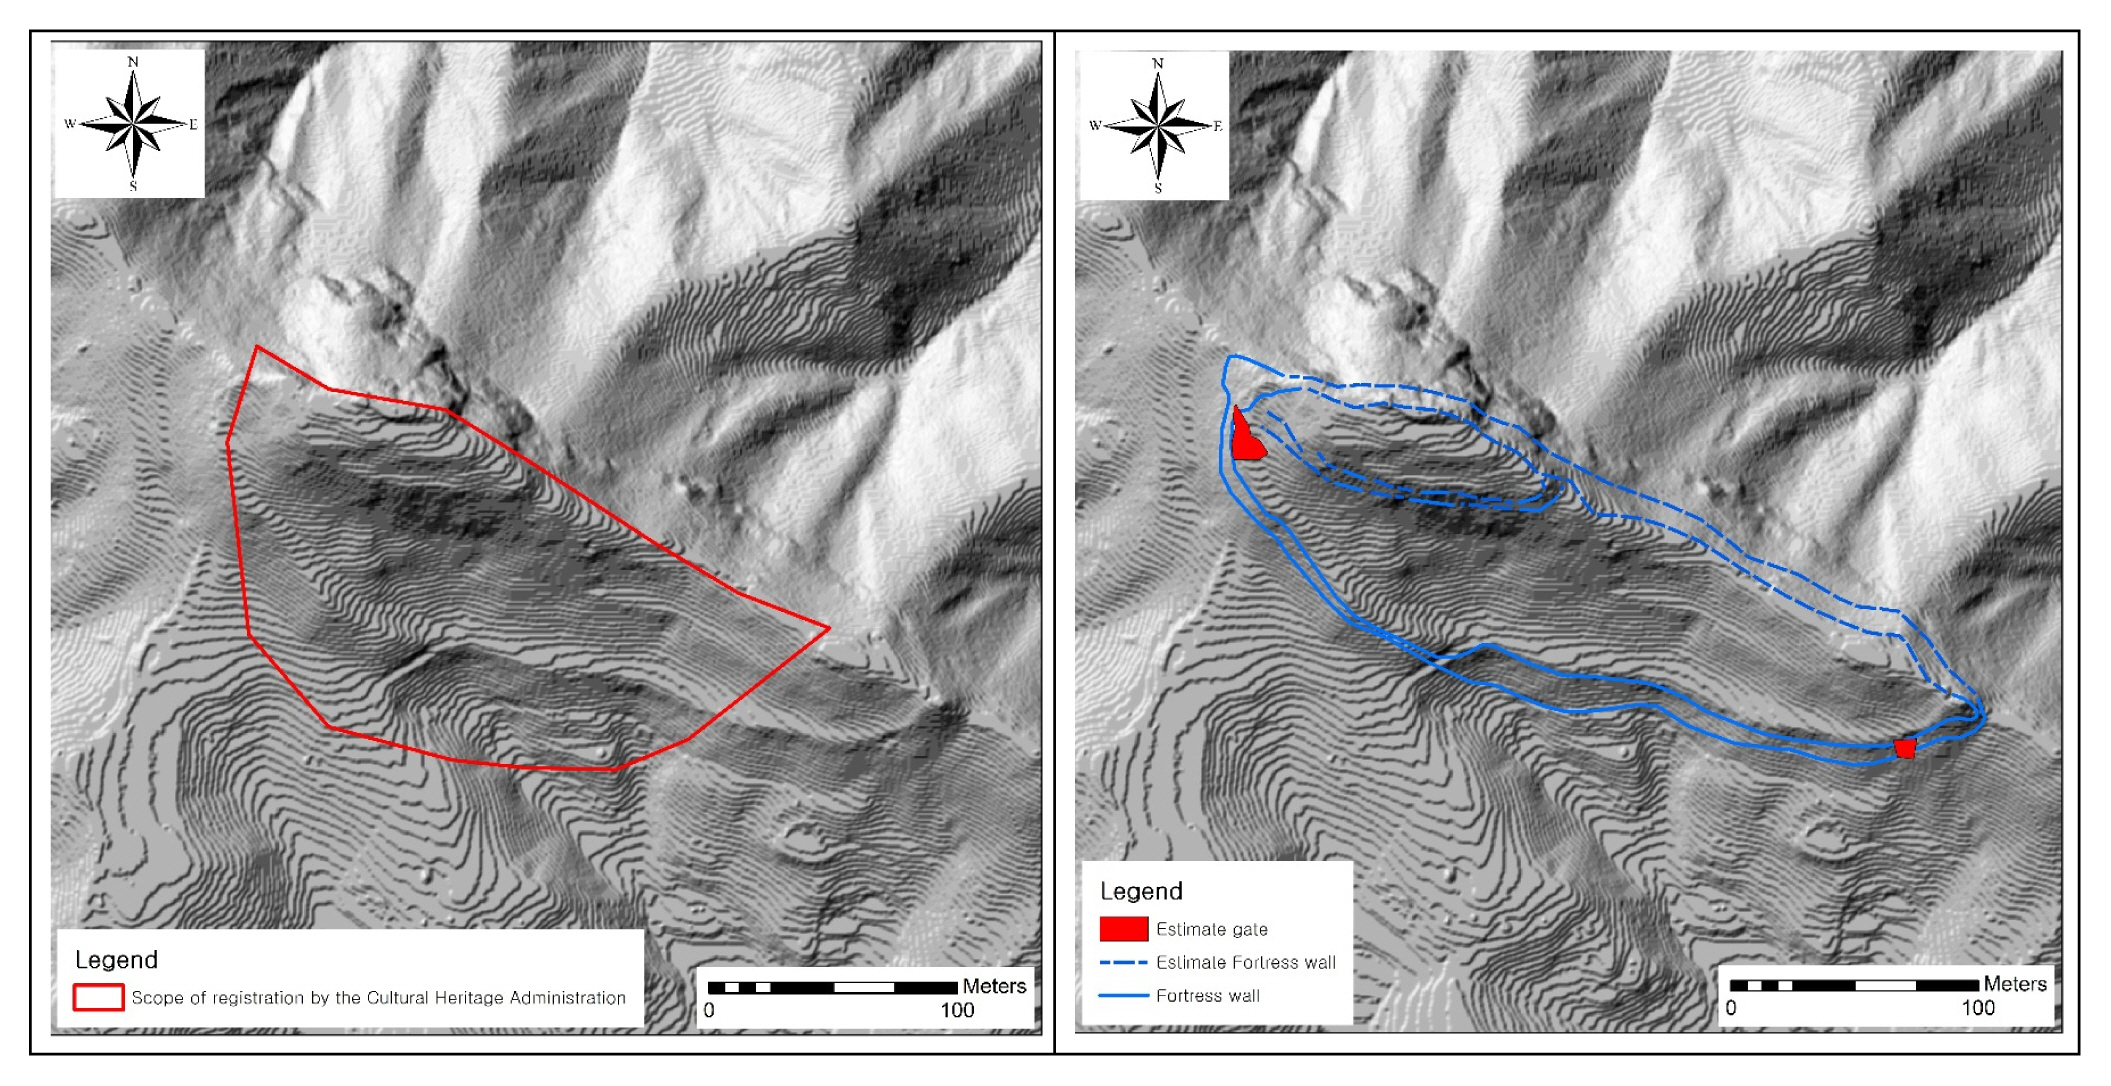
〈Fig. 20〉 presents the comparison between the cultural heritage protection area of Seseong Mountain Fortress that was registered with the Cultural Heritage Administration and the field survey results conducted in 2107. The results obtained from LiDAR are different from the cultural heritage protection area of Seseong Mountain Fortress registered with the Cultural Heritage Administration, but are similar to the results of the field survey conducted in 2017. Therefore, it is believed that with LiDAR data, useful results can be obtained with remote sensing without having to conduct field surveys.
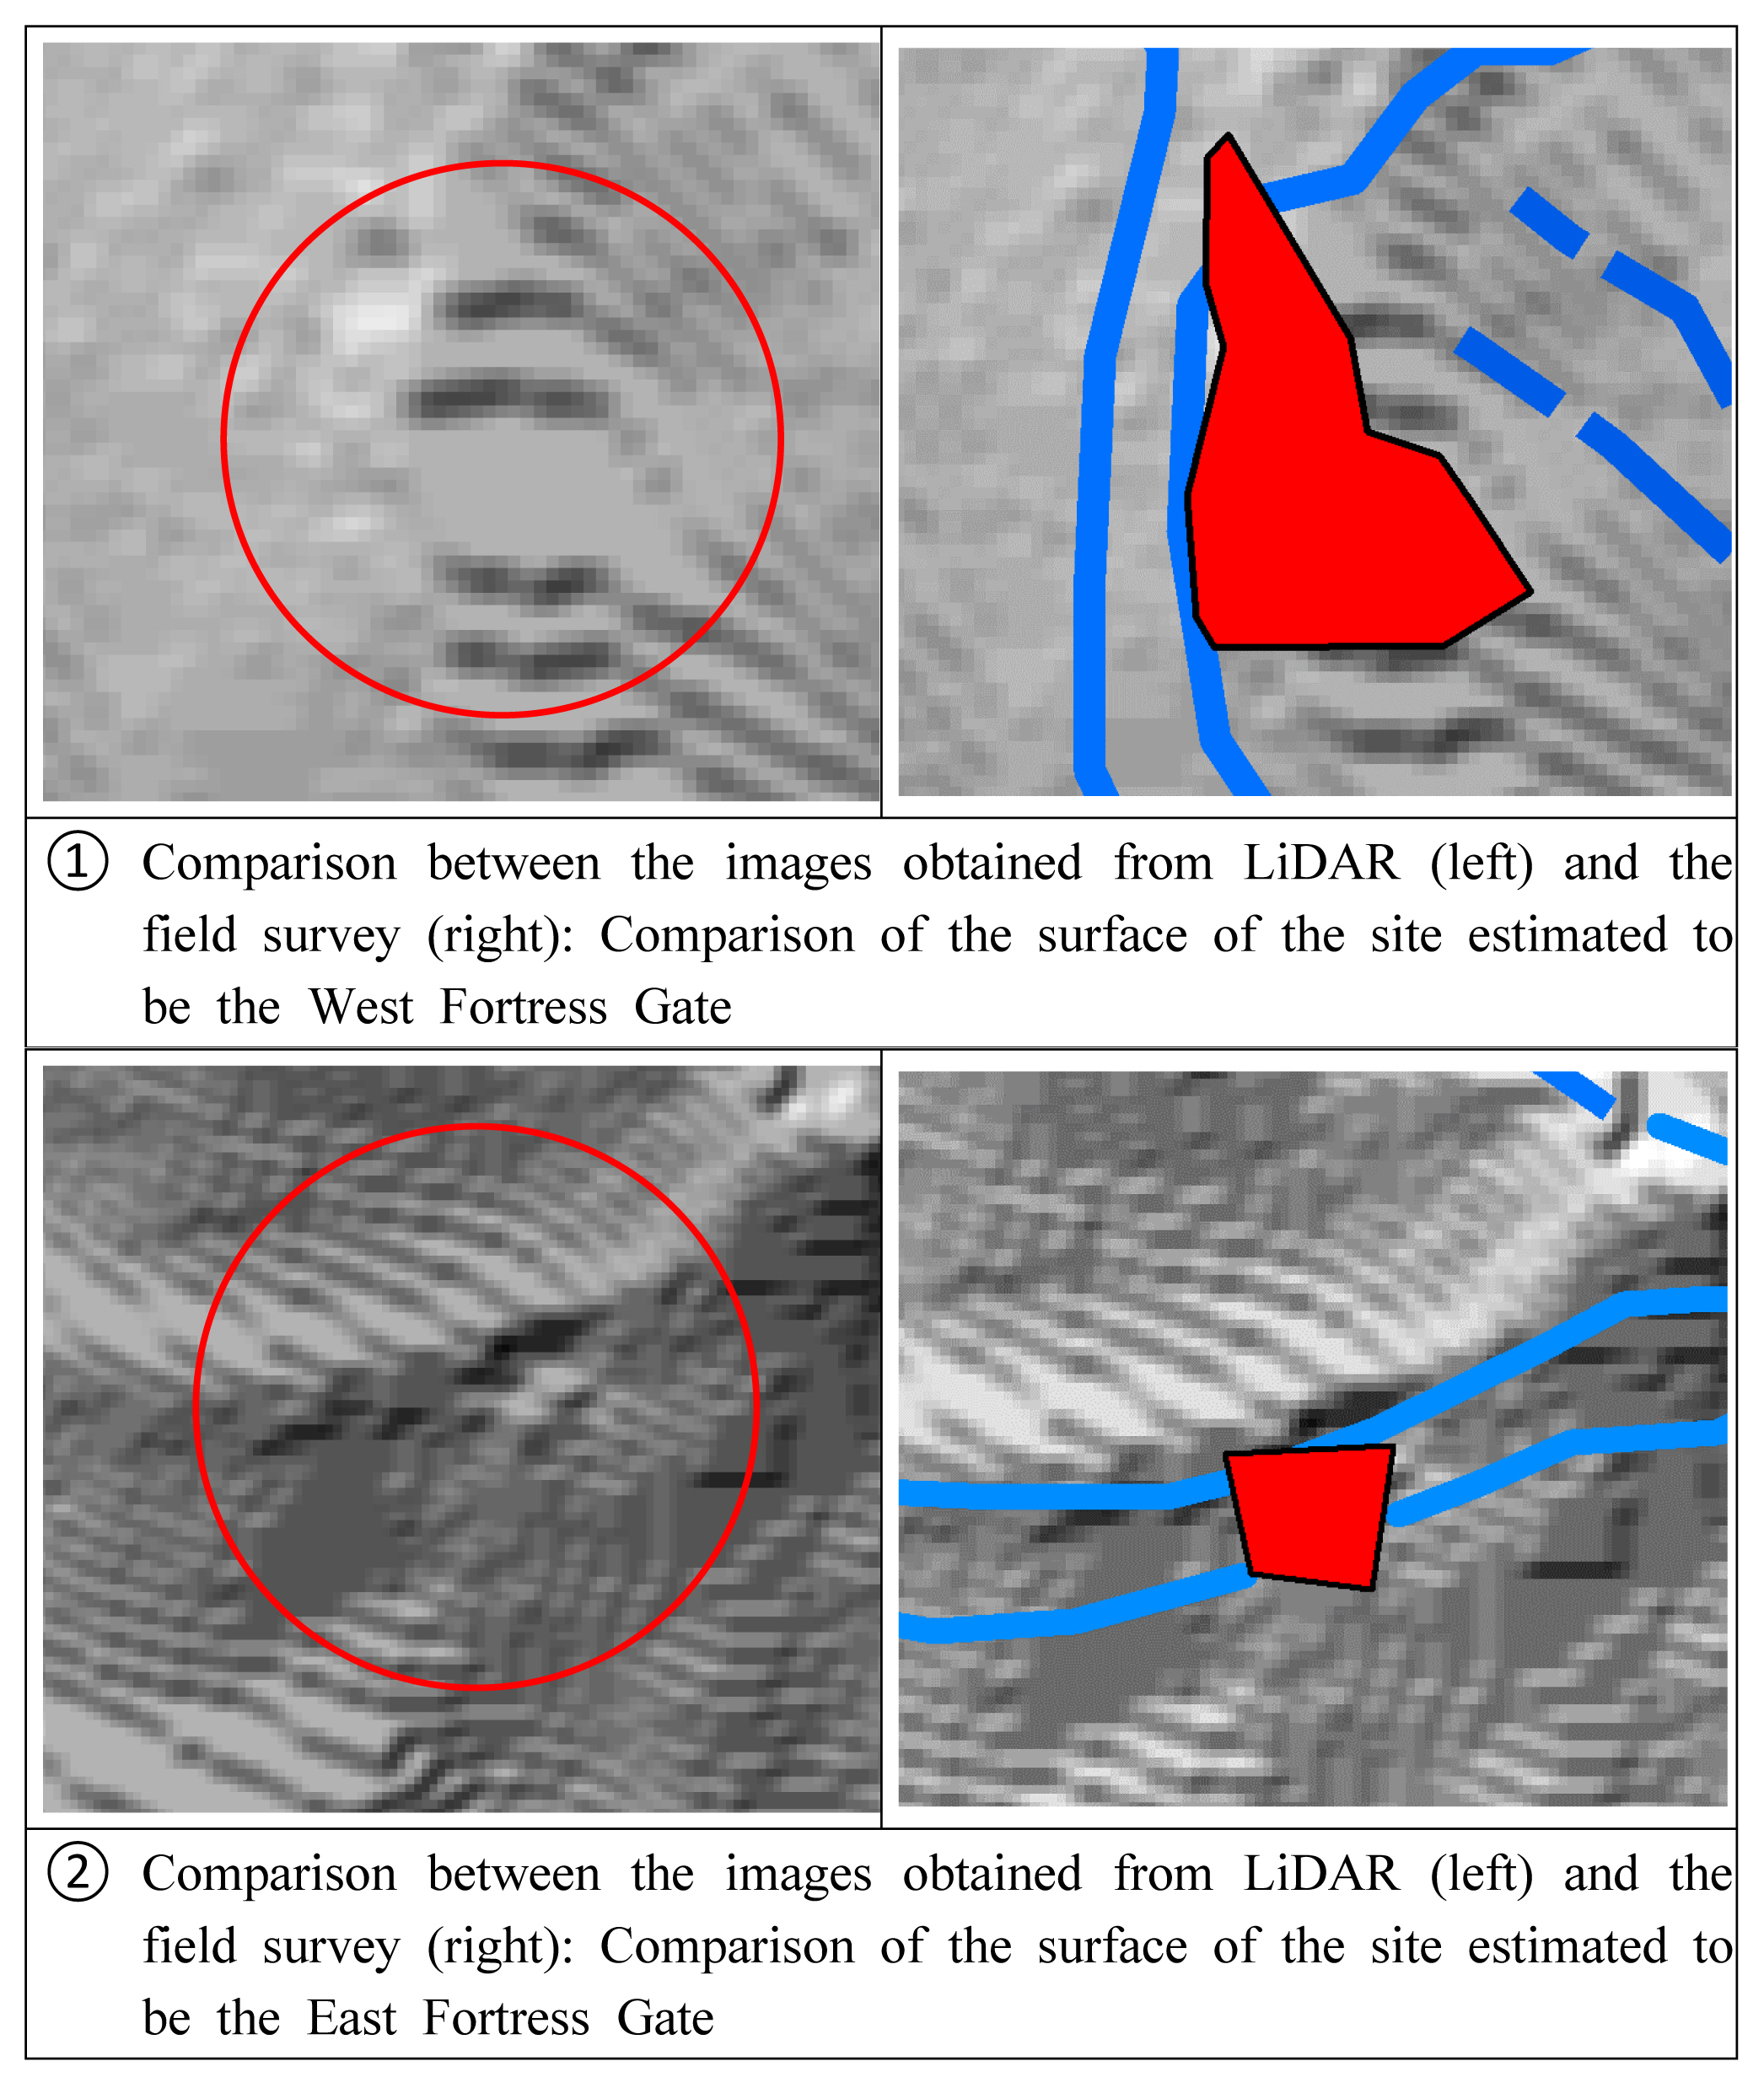
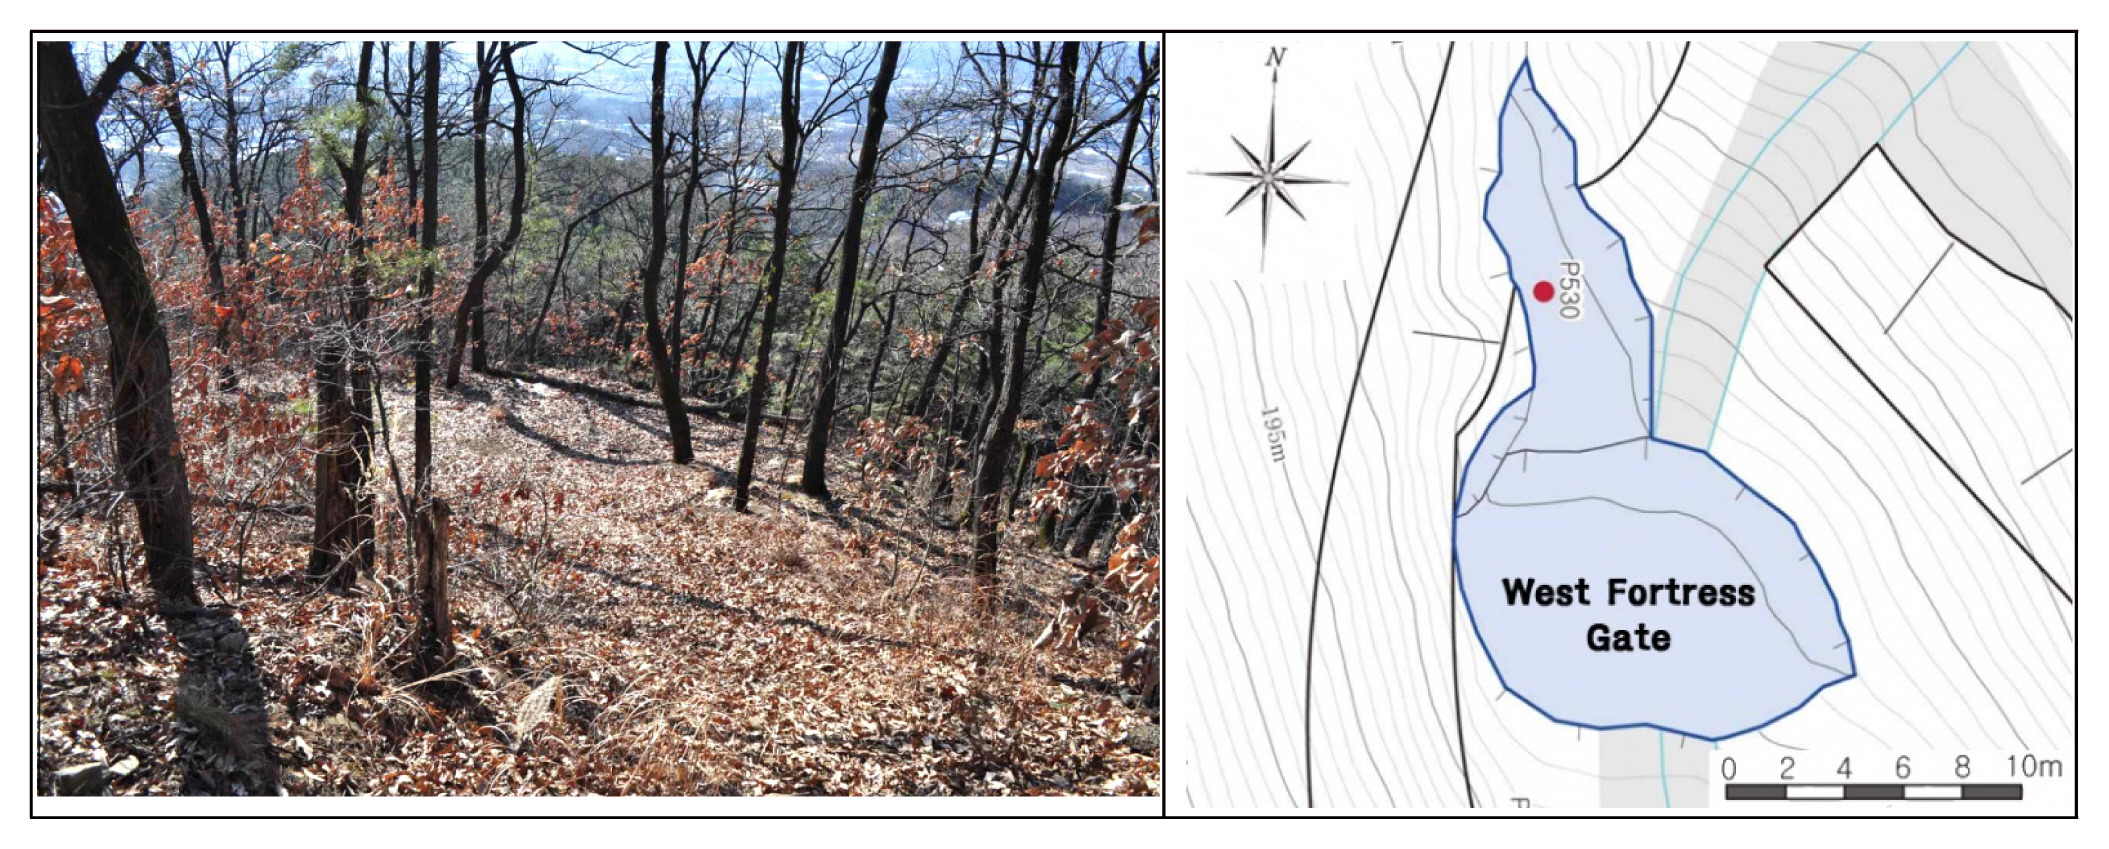
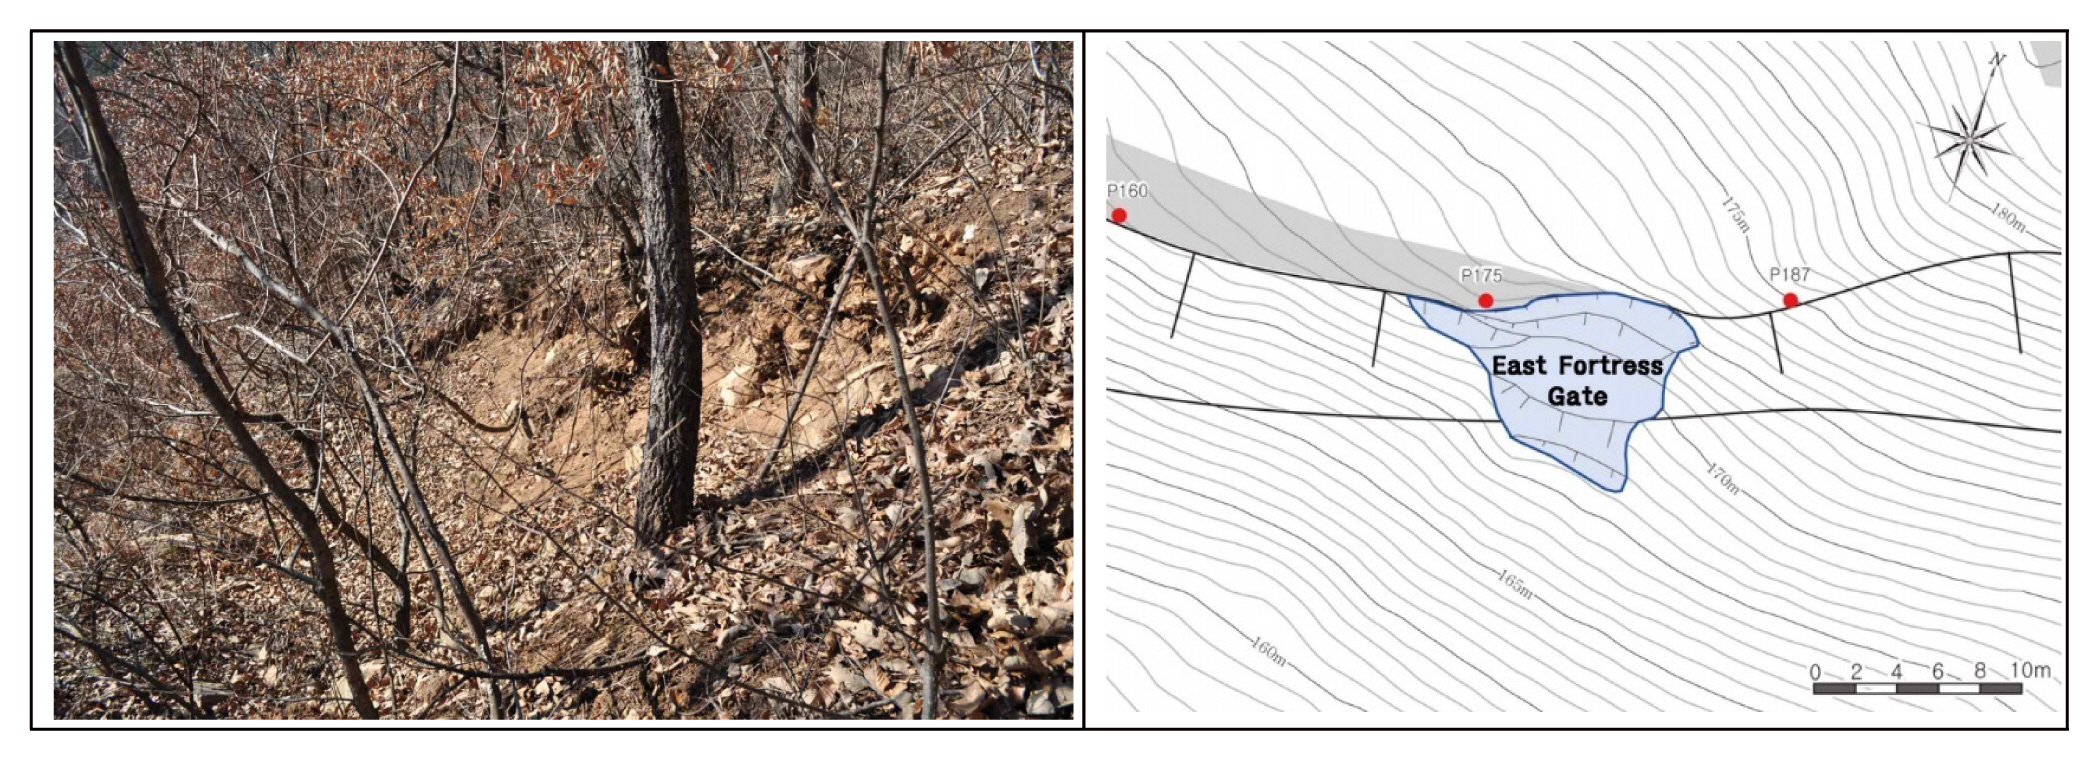
〈Fig. 22〉 shows a comparison between the estimated spatial range of a facility on the site obtained from the field survey and LiDAR data. As a result of comparing the estimated site of East and West Fortress Gates from the field survey and LiDAR visualization data, some features of the surface are shown on the hill shading map. As we have seen previously, even in the hill shading map, man-made features are properly represented visually.
In 〈Fig. 23〉 and 〈Fig. 24〉, the differences between the LiDAR analysis result, the drawing, and the actual site can be observed. LiDAR can sometimes provide more information than we actually see.
In general, interpretation of archaeological data inevitably involves the subjective viewpoints of researchers. However, if LiDAR data is visualized to derive quantitative results, it will be of considerable use to archaeological research.26 In particular, if LiDAR visualization data produced through various filters can be used, detailed representation of the natural terrain or artificial objects can be visualized and verified to achieve comprehensive interpretations.
LiDAR Technology Applications
As discussed above, research on the application of LiDAR technology to exploration of archaeological sites is actively carried out in the field of archeology. The surface analysis and image visualization filtering techniques introduced in this paper, as well as analysis using 3D modeling and GIS, are also implemented in archaeological sites.
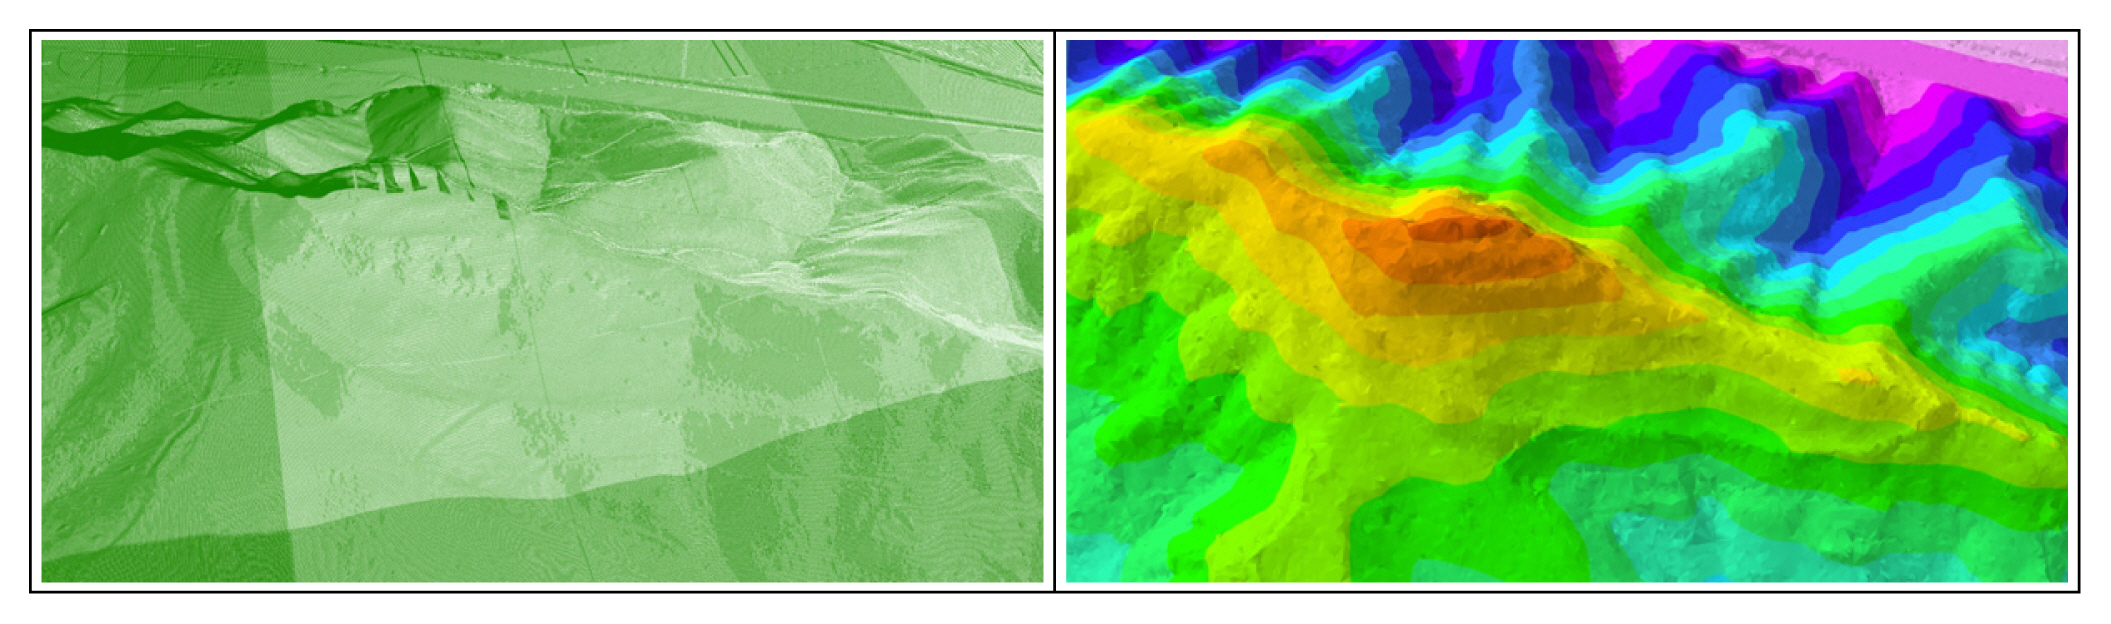
3D modeling of terrain has many advantages. First, through a 3D visualization of the terrain, effective reconstruction of the space can be derived for improved understanding. In this case, by using a GIS program, a cross-sectional view of the study area can be easily obtained, and various numerical values such as the area and length of the analyzed output can be measured. These techniques have the effect of allowing archaeologists to make some predictions about the actual terrain of the site without visits or field surveys of the site.27(Fig. 25, 26)
Currently, research related to remote sensing, including aerial LiDAR, is evolving to a new level by combining with the latest technology. In particular, cases of research using satellite LiDAR, satellite image analysis, and AI are gradually increasing. In Afghanistan, there is a case of a remote sensing-based survey of archaeological sites near Kandahar, Afghanistan using publicly available satellite imagery. This research was not simply a survey of archaeological remains, but also a study on the signs of damage caused by looting and illicit excavations.28
Also, there have been studies with application of satellite imagery and AI. In a study funded by the Swiss National Science Foundation, Convolution Neural Network (CNN) was applied to satellite imagery analysis to perform remote sensing research on mapping of the Scythians mound and damage assessment.29 A research team at Yamagata University in Japan discovered 143 new geoglyphs on the Nasca Pampa through a combination of satellite imagery analysis and AI technology with support from IBM Japan.30
As seen from these cases and previous studies, remote sensing technology in archeology is providing a new means of analysis to archaeologists with the integration of satellite imagery and AI technology. If these methods can be implemented in South Korea, they can be utilized for research on the archaeological remains of the DMZ or North Korea, and places with restricted visitation.
However, since aviation LiDAR requires the mobilization of aviation equipment, a prior approval process is required. In addition, significant research funding is required to use satellite LiDAR data. Since data collection and research also require related technical knowledge, it is necessary to train experts. This cannot be done in a short time and requires long-term planning. However, if these drawbacks are overcome, LiDAR can be an excellent archaeological research tool.
At present, in South Korea, research on remote sensing such as LiDAR is in its early stage. There have been cases where LiDAR projects have been carried out for some cultural heritage sites31 but implementation of the technology in the field of archeology is still very limited. Currently, many mountain fortresses are scattered throughout Korea, and a detailed investigation is required. Although the approximate location can be identified by the past cultural relic distribution map, a lot of manpower, financial resources, and time are required to conduct a field investigation. Aerial LiDAR is a means to overcome these hurdles. It is expected that this study will provide an opportunity for the promotion of remote sensing research in the field of archeology in Korea.
Conclusion
In this paper, we applied LiDAR, one of the remote sensing technologies, to a real archaeological site to examine the utility and applicability of the method for archaeological research in Korea. LiDAR’s strength in terms of easy acquisition of surface data even in the midst of forests or jungles is actively applied for investigation of castles or stone alignment (cairns), historical landscapes or distribution and patterns of human settlement. Therefore, LiDAR analysis is not just one of the remote sensing technologies, but also a part of aerial archeology.
However, remote sensing technologies including LiDAR have not been widely implemented in Korean archeology research. Although there were studies on the reconstruction of ancient topographical features or fortress walls with aerial archaeology, remote sensing technology, which assures scientific and objective basis of research, is still an unfamiliar field for many researchers in Korean archeology.
In recent trends, remote sensing technology is actively applied in the global archaeological community and integrated with satellite imagery or AI technology. It is expected that the utilization of these technologies in the community of Korean archaeologists will enable archaeological surveys of remote and isolated areas such as the DMZ or North Korea.